Whether you’re in the crypto trading, copy trading, or Forex trading world, you’ll need to know what the most common trading chart patterns indicate. While trading in these industries can involve a bit of guesswork, you’ll still need to base your guesses and predictions on some kind of technical data.
That’s where chart patterns come in. These chart patterns are recurring ways the market moves in every timeframe and asset class. Traders use Forex chart patterns to make informed guesses and decisions about market behavior, which can potentially lead to profits.
But before we get into the charts themselves, let’s first define some specific terms that you’re going to see again and again when analyzing these Forex chart patterns.
The Essentials of Understanding Forex Chart Patterns
Before we jump into analyzing Forex chart patterns, let’s get on the same page with some key terms that will help you understand how prices move and what that means for Forex traders. First off, we have support and resistance.
Support is like a safety net for prices—when they drop to this level, buying usually kicks in, and the price might bounce back up. On the flip side, resistance is where prices tend to hit a ceiling and stop rising because selling pressure kicks in.
It’s also super important to get a feel for market sentiment. Bearish means traders are expecting prices to drop, while bullish means they think prices will rise. When traders go for a short position, they’re betting on prices falling, while a long position is all about expecting prices to climb.
Other handy terms to know are pips, which are the smallest price movements, and pip height, which helps you figure out potential price changes. A pullback is just a temporary dip in price during a trend, and a retest happens when prices check back at a previous breakout level. If prices are moving within a narrow range, that’s consolidation, a sign that traders are a bit unsure.
Trendlines show you the general direction of the market, while breakouts happen when prices break through support or resistance levels, suggesting the trend will continue. Higher volume makes patterns more reliable, and a false breakout is when prices briefly go beyond support or resistance but then fall back.
Now that we have that covered, let’s dive into the common Forex trading chart patterns, what they mean, and some examples!
Give yourself a better chance at the Forex market by hosting your trading platform right next to your broker. Want to Improve your Trading?
Analyzing and Understanding Forex Chart Patterns
Forex chart patterns can be broken down into three general groups: reversal patterns, continuation patterns, and special patterns. All three of these chart pattern types each cover a number of unique patterns themselves, which we’re going to discuss and analyze. We’ll also look at some common candlestick patterns that have their own unique formations.
Reversal Patterns
First up, we have reversal patterns that signal a potential change in the direction of the current trend, meaning a market that was trending upwards may soon start declining, or vice versa.
Head and Shoulder and Inverse Head and Shoulder Patterns
The head & shoulders pattern is a well-known and reliable reversal signal in Forex trading, indicating a shift from a bullish to a bearish trend. It consists of three peaks: the middle, or “head,” being the highest, flanked by two lower “shoulders.”
The key feature is the neckline, which connects the lows between the head and shoulders and acts as a support level. When the price breaks below the neckline, the reversal is confirmed, signaling a potential downtrend.
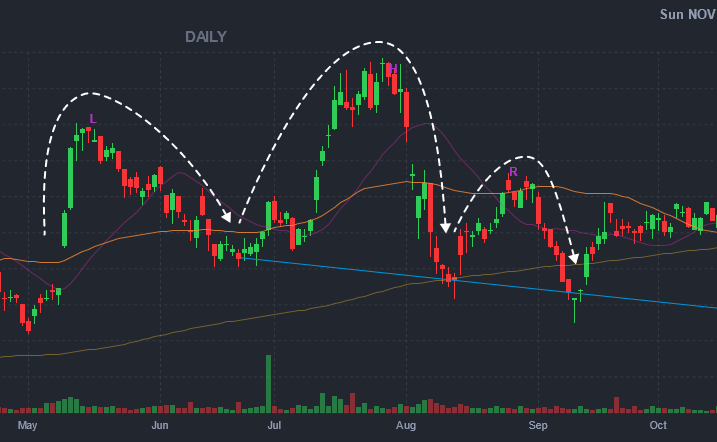
Traders typically enter a short position after the neckline is broken, with a stop loss placed above the right shoulder. The target price is projected by measuring the distance from the head to the neckline and applying it downward from the breakout point.
In the EUR/USD uptrend, the price peaks at 1.1200 (left shoulder), rises to 1.1300 (head), and forms a right shoulder at 1.1250 before retracing. A breakout above the neckline at 1.1100 signals a bearish reversal, prompting a short position.
The inverse head and shoulders pattern is the opposite of this. It’s a bullish reversal pattern where the roles of peaks and troughs are reversed. This pattern predicts a reversal from a downtrend to an uptrend.
Traders enter a long position when the price breaks above the neckline, ideally confirming with increased volume or a retest. To avoid false breakouts, a stop loss is set below the right shoulder or head. The target price is determined by measuring the distance from the head to the neckline and projecting it upward.
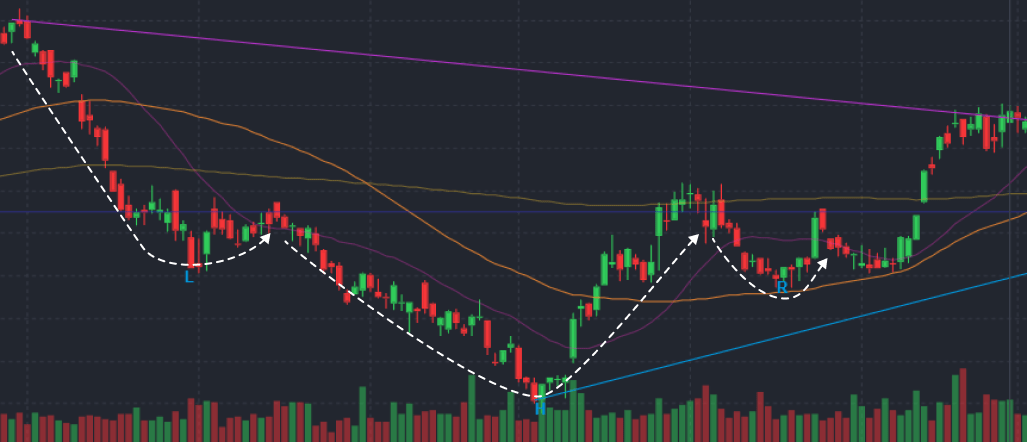
In a downtrend, EUR/USD hits 1.1000 (left shoulder), drops to 1.0900 (head), and rises to 1.1100. A lower dip to 1.0950 forms the right shoulder. A breakout above 1.1100 confirms a bullish reversal, prompting a long position based on the pattern’s height.
These reversal patterns are two of the most common and most reliable Forex day trading patterns.
The Double Top and Double Bottom Pattern
Next up, we have the double top pattern, which is a bearish reversal signal in Forex trading, indicating a shift from an uptrend to a downtrend. It’s made up of two consecutive peaks at roughly the same price level, separated by a trough.
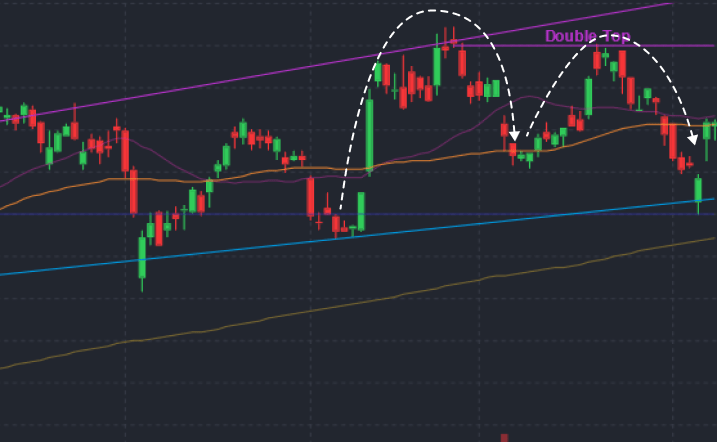
Once again, the neckline is a key feature, drawn at the trough’s low and acting as a support level. The reversal is confirmed when the price breaks below this neckline, signaling a potential downtrend.
Traders typically enter a short position after the neckline is broken, placing a stop loss above the second peak to mitigate risk. The target price is calculated by measuring the height of the pattern (the distance between the peaks and the neckline) and projecting it downward from the breakout point.
For example, in the EUR/USD currency pair, after a sustained uptrend, the price peaks at 1.1500 (first peak), retraces to 1.1400 (trough), and then attempts another rally, forming a second peak at 1.1500 before dropping. A breakout below 1.1400 confirms the double top, prompting a short position with a target price at 1.1300, based on the 100-pip height of the pattern.
The opposite of this pattern is the double bottom pattern, which indicates a bullish reversal, marking a shift from a downtrend to an uptrend. It features two consecutive lows at about the same price level, separated by a peak. The neckline, drawn at the peak’s high, confirms the reversal when breached.
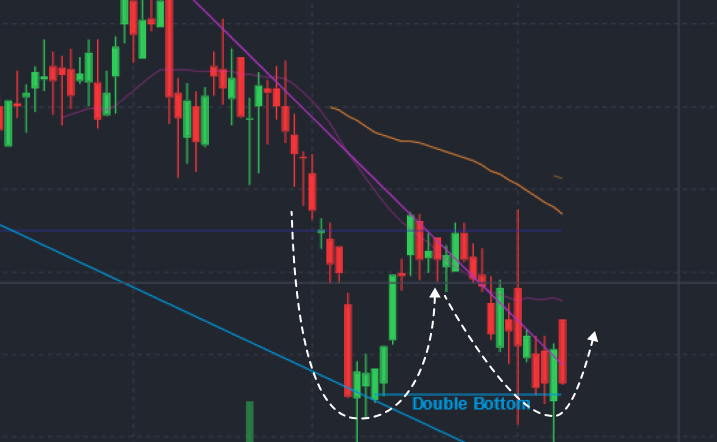
Traders enter a long position upon the breakout above the neckline, placing a stop loss below the second low. The target price is determined by projecting the distance from the lows to the neckline upward.
In EUR/USD, after a downtrend, the price hits 1.1000 (first low), retraces to 1.1100 (peak), and drops to 1.1000 again. A breakout above 1.1100 confirms the double bottom, prompting a long position targeting 1.1200.
Both of these reversal patterns are examples of the most common and reliable day trading patterns.
The Triple Top and Triple Bottom Patterns
Another common reversal pattern is the triple top pattern, which is a bearish reversal chart pattern indicating a potential shift from a bullish to a bearish trend. It consists of three consecutive peaks at approximately the same price level, signaling that upward momentum is weakening.
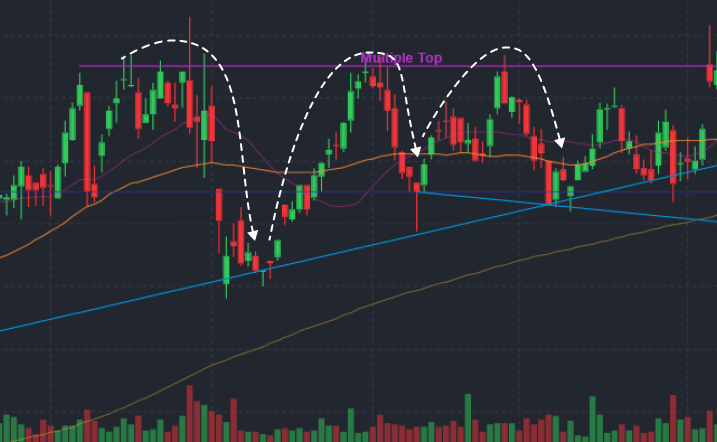
Again, the key feature is the neckline, which connects the lows between the peaks and acts as a support level. The reversal is confirmed when the price breaks below the neckline, signaling a possible downtrend.
Traders typically enter a short position after the neckline is broken, with a stop loss placed above the third peak. The target price is calculated by measuring the distance from the peaks to the neckline and projecting it downward from the breakout point.
In the GBP/USD uptrend, the price peaks at 1.3500 (first peak), retraces to 1.3400 (neckline), rallies to 1.3500 (second peak), and fails to break higher, retracing again to 1.3400. A third peak forms at 1.3500 before retracing again. When the price breaks below 1.3400, it confirms the bearish reversal, prompting a short position.
Similar to the previous patterns, the opposite of the triple top pattern is the triple bottom pattern, which signals a bullish reversal after a sustained downtrend. It consists of three consecutive lows at roughly the same price level, indicating that selling pressure is weakening. The neckline connects the peaks between the lows, and a breakout above this level confirms the reversal.
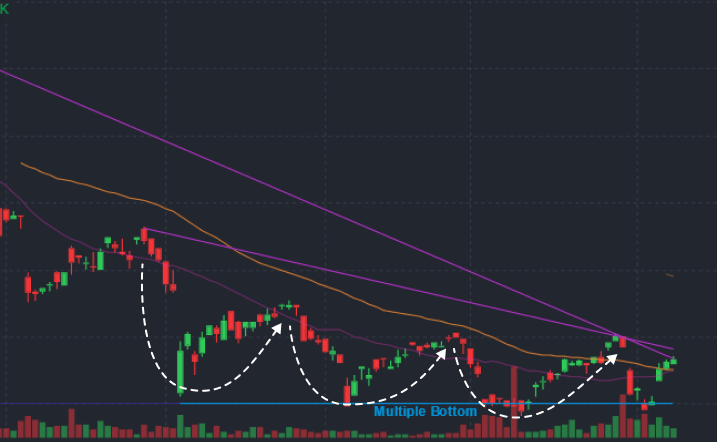
Traders enter a long position when the price breaks above the neckline, ideally with increased volume or a retest. To mitigate false breakouts, a stop loss is set below the third low. The target price is projected upward based on the distance from the lows to the neckline.
For instance, in the USD/JPY downtrend, the price hits 110.00 (first low), rallies to 111.00 (neckline), and forms two more lows at 110.00 before breaking above 111.00, confirming the bullish reversal and prompting a long position.
Continuation Patterns
With the most common and reliable reversal patterns covered, let’s talk about continuation patterns. These patterns suggest that the current trend is likely to continue, hence the name. This means that an uptrend will continue to rise, or a downtrend will keep declining.
The Bull Flag and Bear Flag Patterns
I’m sorry to say that the bull and bear flag patterns don’t actually look like bears and bulls. That aside, the Bull Flag pattern is a continuation chart pattern that forms after a strong upward price movement, known as the flagpole, followed by a consolidation phase resembling a small rectangle or downward-sloping channel. This pattern indicates a brief pause before the price continues its bullish trend.
A key characteristic is the flagpole, which represents strong bullish momentum, and the flag, signifying a consolidation phase that should not retrace more than 50% of the flagpole’s length.
The Bull Flag is confirmed when the price breaks above the upper boundary of the flag with strong volume, signaling a continuation of the upward movement. Traders enter a long position upon the breakout, setting a target based on the flagpole length.
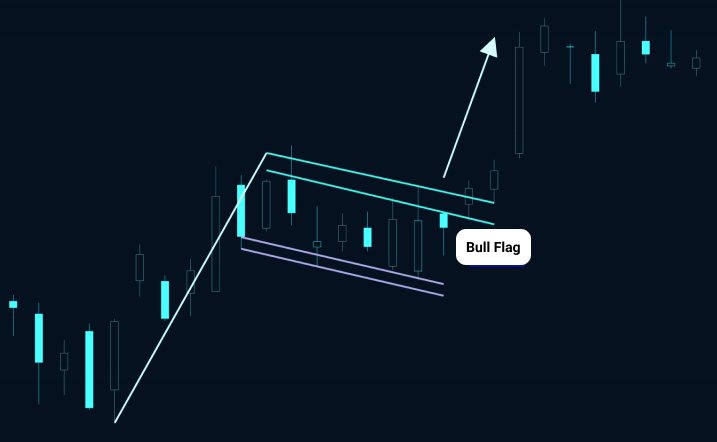
For example, in the EUR/USD pair, the price rallies from 1.1500 to 1.1700, forming the flagpole. After reaching 1.1700, the price consolidates between 1.1680 and 1.1600, forming the flag. The pattern confirms when the price breaks above 1.1680 with increased volume, prompting a long position with a target set at 1.1880, calculated from the flagpole length.
Conversely, the Bear Flag pattern is a bearish continuation chart pattern that forms after a sharp downward price movement. It consists of a steep price drop (the flagpole) followed by a small upward-sloping consolidation (the flag), indicating a temporary pause before the price continues downward.
The Bear Flag is confirmed when the price breaks below the lower boundary of the flag with strong volume. Traders typically enter a short position at this breakout, targeting a price movement equal to the flagpole length.
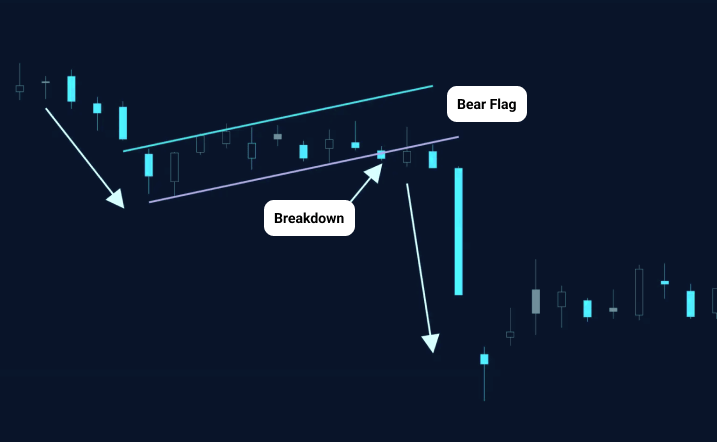
For instance, in the AUD/USD pair, the price drops from 0.7000 to 0.6800, forming the flagpole. After consolidation between 0.6850 and 0.6900, the pattern is confirmed with a break below 0.6850, prompting a short position with a target price of 0.6650.
Both of these continuation patterns are also two of the most common and most reliable Forex day trading patterns.The Ascending Triangle and Descending Triangle Patterns
While flags show brief pauses in price movement, triangles involve a narrowing of price action that gradually increases momentum for the next breakout. The Ascending Triangle pattern is a bullish continuation pattern that forms during an uptrend when the price consolidates between a horizontal resistance line and a rising support line.
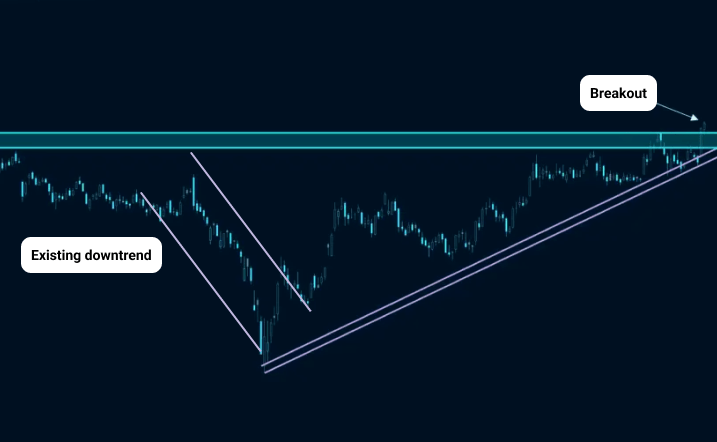
Traders typically enter a long position upon the breakout, with a stop loss placed below the rising support line or the most recent low. The target price is calculated by measuring the triangle’s height (distance between resistance and support) and projecting it upward from the breakout point. In an example with EUR/USD, if resistance is at 1.1500 and support at 1.1400, a confirmed breakout above 1.1500 with volume suggests a target price of 1.1600.
The Descending Triangle pattern, a bearish continuation pattern, forms when the price consolidates between a flat support level and a descending resistance line. This pattern indicates that sellers are becoming more aggressive. A breakdown below the support line with increased volume confirms this pattern, signaling a likely continuation of the downtrend.
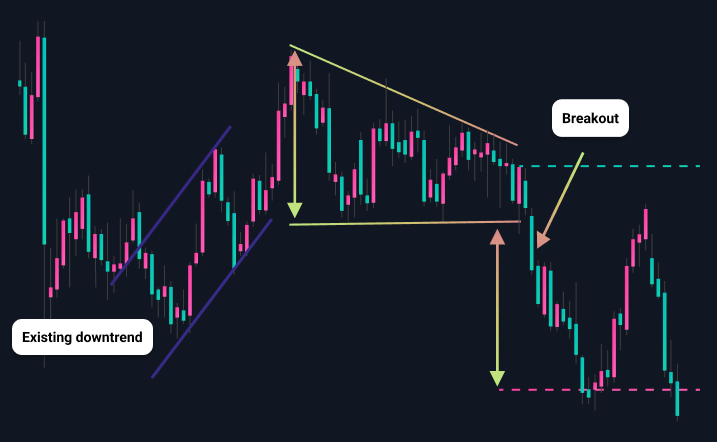
For this pattern, traders enter a short position upon the breakdown, with a stop loss above the falling resistance line or the most recent high. The target price is projected downward based on the height of the triangle. For instance, in GBP/USD, if support is at 1.3000 and resistance at 1.3100, a breakdown below 1.3000 with volume suggests a target price of 1.2900.
Both patterns are effective in strong trends, but you should confirm breakouts with volume to avoid false signals. Both of these patterns are also two of the most common and most reliable patterns for Forex day trading.
Unique and Special Chart Patterns
While the following trading chart patterns may be continuation or reversal patterns in nature, they have unique characteristics that makes them different from other reversal or continuation.
The Flat Breakout Pattern
The Flat Breakout Pattern is a unique continuation chart patterns, as it typically shows up during a phase of horizontal price consolidation rather than the typical upward or downward sloping trendlines associated with other patterns.
This suggests that the current trend might keep going after a phase where everyone in the market was unsure. During this time, buyers and sellers are battling for control, causing prices to move up and down between set support and resistance levels.
When the price breaks out of the flat, this pattern is confirmed; a bullish breakout signals a movement above resistance, while a bearish breakout indicates a movement below support, ideally supported by strong trading volume.
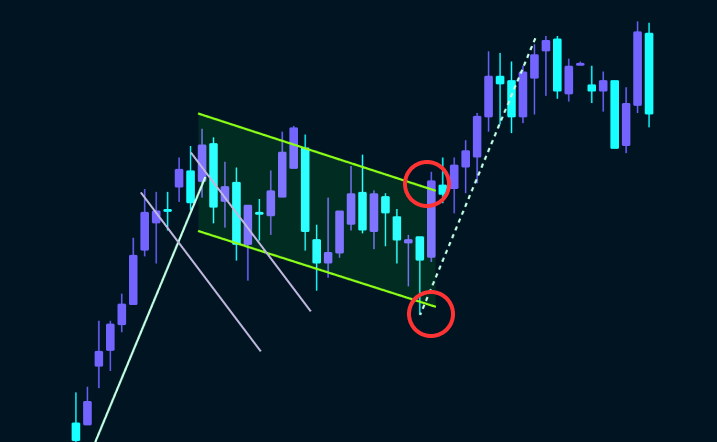
For instance, if the EUR/USD consolidates between 1.1000 and 1.1050 and then breaks out, the target price would be adjusted accordingly, signaling the potential for significant price movement.
The Broadening Formation (Megaphone Pattern)
The Broadening Formation (Megaphone Pattern) is another unique chart pattern characterized by alternating higher highs and lower lows, representing increased volatility and indecision in the market.
This pattern is different from the usual continuation ones that show tightening price ranges. Instead, it reveals a back-and-forth battle between buyers and sellers, which leads to some unpredictable price movements. As traders get into this tug-of-war, the price moves within widening trendlines, hinting at possible breakouts in either direction.
When the price breaks above the upper resistance line, it suggests bullish momentum, while a breakout below the lower support line indicates bearish momentum. Confirming the breakout with strong trading volume enhances the reliability of the pattern.
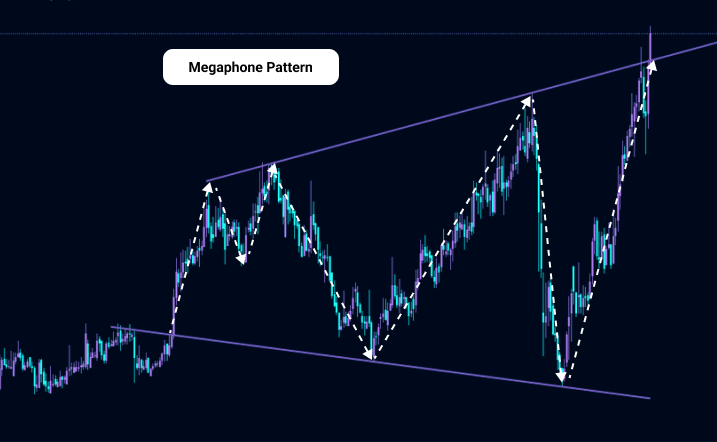
For example, if the USD/JPY forms a broadening formation between 110.00 and 112.00, a breakout above 112.00 would target a significant price movement, highlighting the potential for large swings in the market.
Candlestick Patterns
Candlestick Patterns offer valuable insights into market sentiment and are crucial for identifying potential reversals or continuations in price movements. Highly effective for short-term analysis, Forex candle patterns gain even more reliability when combined with other technical indicators. Traders frequently leverage these formations to make quick decisions in both bullish and bearish market conditions, enhancing their strategies for more informed trading.
The Gap Pattern (Gapping Play) is a unique candlestick formation characterized by a significant price difference between two consecutive trading periods, creating a “gap” on the chart, hence the name. It is also one of the most common and reliable Forex day trading patterns.
This pattern indicates strong momentum and potential continuation or reversal of the trend, often arising from overnight news. Traders capitalize on gaps, entering positions based on the gap direction and confirming with additional indicators.
Conversely, the Three Crows Pattern, or Three Buddhas, is a bearish reversal pattern formed by three consecutive long-bodied bearish candles after an uptrend. This signals strong selling pressure and a shift in market sentiment. Traders typically enter short positions upon confirmation after the third candle, anticipating a potential price decline.
Final Thoughts
While knowing these Forex chart patterns doesn’t guarantee big profits, it can definitely improve your trading performance. Whether you’re spotting reversal patterns like head and shoulders or continuation patterns like flags, these visuals give you a peek into how the market is moving.
By learning these patterns and adding them to your trading plan, you can get a better idea of where prices might head and manage your risk more effectively.
Just keep in mind that while these chart patterns are great tools, it’s wise to combine them with Cloudzy’s Forex VPS. With pre-installed MT4/MT5, robust specs, including ultra-fast SSD storage, dedicated resources, and 99.9% uptime, our VPS ensures you can execute trades with lightning speed and reliability.
FAQs
What are Forex chart patterns?
Forex chart patterns are recurring ways the market moves in every timeframe and asset class. Traders use Forex chart patterns to make informed guesses and decisions about market behavior, which can potentially lead to profits.
What is the difference between support and resistance in Forex trading?
Support is like a safety net for prices—when they drop to this level, buying usually kicks in, and the price might bounce back up. On the flip side, resistance is where prices tend to hit a ceiling and stop rising because selling pressure kicks in.
What is a Flat Breakout Pattern in Forex?
The Flat Breakout Pattern is a unique continuation chart pattern that typically shows up during a phase of horizontal price consolidation rather than the typical upward or downward-sloping trendlines associated with other patterns. When the price breaks out of the flat, a bullish breakout signals a movement above resistance, while a bearish breakout indicates a movement below support, ideally supported by strong trading volume.
