The best trading indicators have transformed traders’ analysis of market trends and decisions. These indicators for trading serve as indispensable tools in technical analysis, offering insights into price trends, trading volume, and market momentum.
In this guide, we discuss both beginner-friendly and advanced trading indicators to help you build a well-rounded trading strategy. This article covers the basics of what trading indicators are and illustrates how they help in identifying market sentiment, spotting buying or selling opportunities, and managing risk.
What Are Trading Indicators?
Trading indicators are mathematical calculations based on historical price, volume, or open interest data that help traders identify price trends and market sentiment. These tools simplify complex market data, turning it into visual cues and numbers that guide traders in making buying or selling decisions.
Some indicators are leading indicators, offering early signals before a price move occurs, while others are lagging indicators that confirm trends once they have developed.
Trading indicators can evaluate conditions such as overbought and oversold levels, detect momentum shifts, and determine key support and resistance areas. For instance, tools like the Moving Average Convergence Divergence (MACD), Relative Strength Index (RSI), and Bollinger Bands provide insight into market dynamics and help assess whether a trend will continue or reverse.
These indicators for trading are key for both beginners and experienced traders alike, enabling them to develop and refine a trading strategy that adapts to changing market conditions.
Now that you have a clear understanding of how trading indicators function and how they assist in evaluating market trends, let us explore the best trading indicators for beginners. These tools combine simplicity with powerful insights, providing an ideal starting point for new traders.
Best Trading Indicators for Beginners
For those just starting their trading journey, selecting the right tools lays a solid foundation. Here are some of the best trading indicators for beginners, along with expert advice and real-world examples:
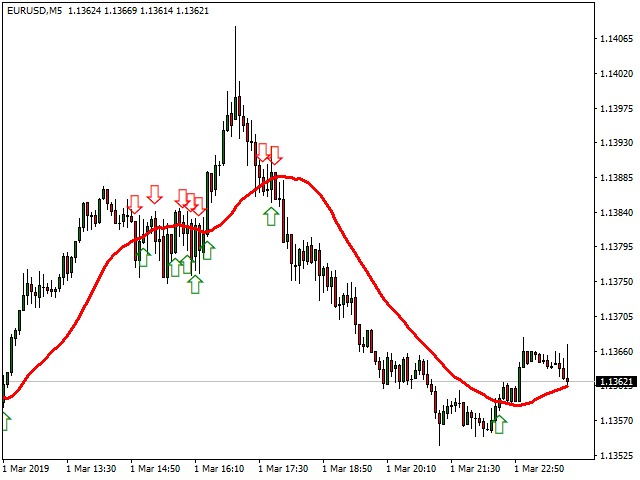
Moving Averages (MA)
- A Moving Average calculates the average price over a set period, smoothing out short-term fluctuations to reveal the price trend. Variants include the Simple Moving Average (SMA) and the Exponential Moving Average (EMA).
- It provides a clear visual of the trend and acts as dynamic support or resistance.
- If the 50-day SMA crosses above the 200-day SMA, it may signal the start of an upward trend.
- It’s recommended to use a combination of SMA and EMA to filter out market noise and to cross-reference with trading volume for stronger confirmation.
Relative Strength Index (RSI)
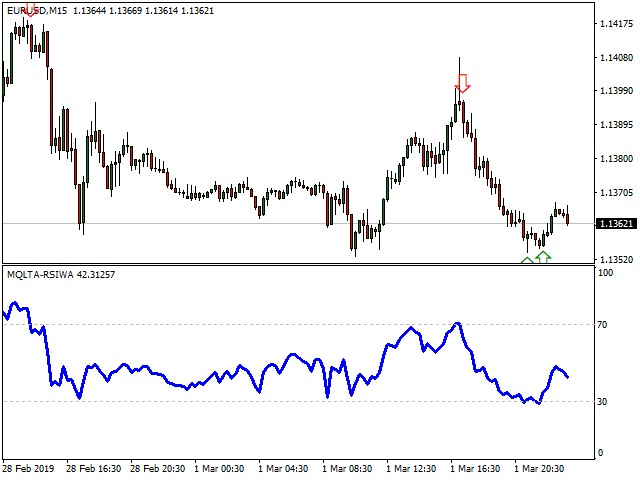
- RSI is a momentum oscillator that measures the speed and change of price movements on a scale from 0 to 100.
- It highlights overbought and oversold conditions, which are critical for timing entry and exit points.
- An RSI reading above 70 might indicate that an asset is overbought, suggesting a potential reversal; conversely, a reading below 30 may hint at oversold conditions.
- Professionals often adjust the default 14-period RSI to 9 for more sensitivity in volatile markets, and they look for divergences between RSI and price action as additional signals.
Moving Average Convergence Divergence (MACD)
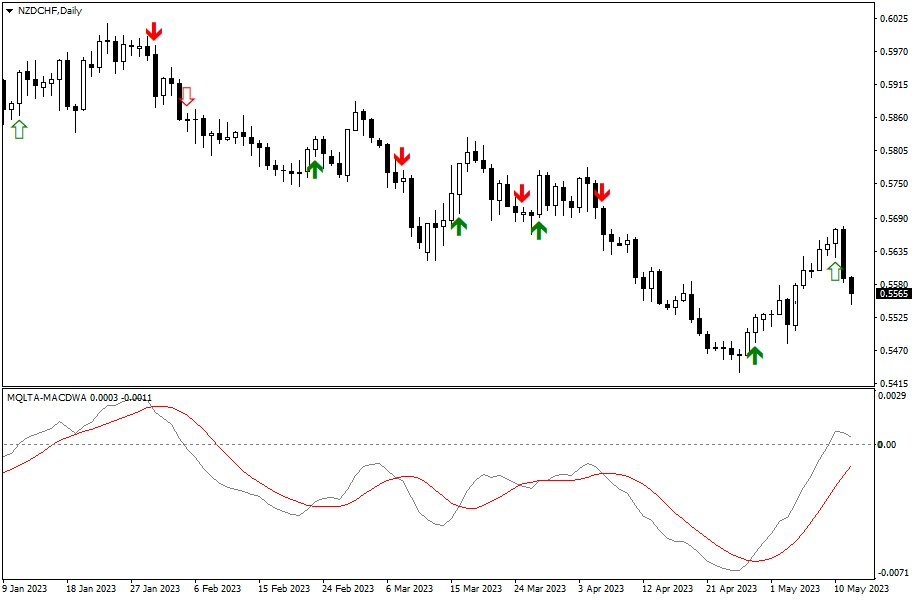
- MACD shows the relationship between two moving averages, typically revealing momentum and trend direction through crossovers.
- It combines trend-following with momentum analysis, making it versatile for confirming price moves.
- A bullish crossover occurs when the MACD line crosses above its signal line, which can be a cue to enter a long position.
- To avoid false signals, especially in choppy markets, MACD signals should be confirmed by other indicators (like RSI).
Bollinger Bands
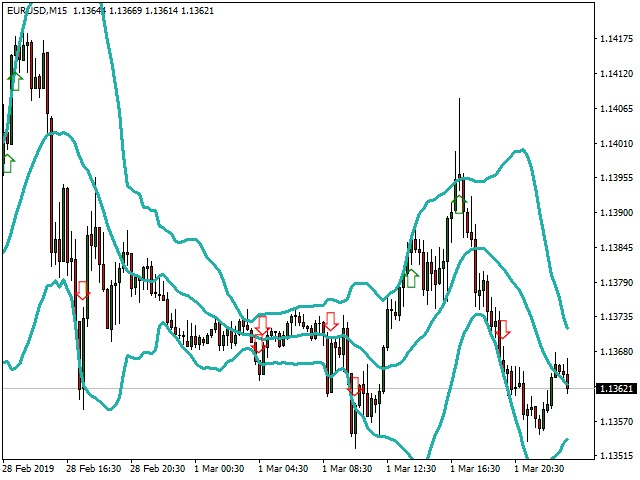
- Bollinger Bands consist of a middle moving average flanked by two bands set at a defined number of standard deviations, reflecting market volatility.
- They visually indicate periods of high or low volatility and can signal potential reversals when prices break out of the bands.
- When price repeatedly touches the upper band, it might signal an overextended market and a potential pullback, while a dip below the lower band could suggest a rebound.
- Traders often use Bollinger Bands in combination with RSI to validate whether an asset is genuinely overbought or oversold.
Support & Resistance Levels
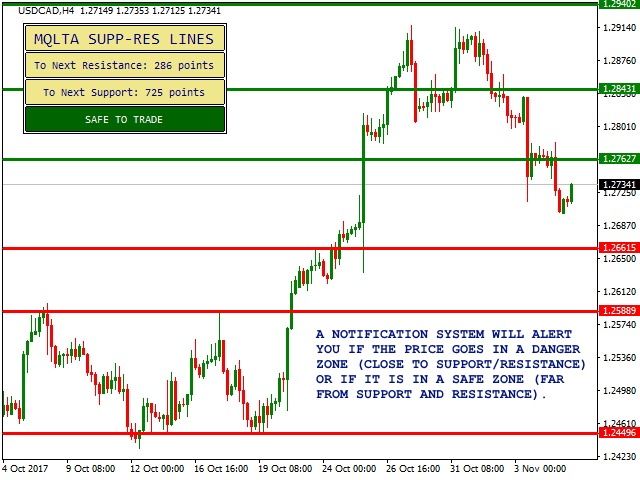
- These levels are horizontal lines on a chart indicating key price points where the market has historically reacted.
- They serve as indicators of market sentiment and help in forecasting potential reversal zones.
- If a stock repeatedly fails to break above a certain price, that level becomes a strong resistance, guiding entry and exit decisions.
- Combining support and resistance analysis with volume indicators can provide deeper insights into the strength and reliability of these levels.
If you’re a more experienced trader, you may already know and use these trading indicators. That’s why, up next, we explore the advanced trading indicators for pros, designed to provide deeper insights and fine-tune your trading strategy.
Advanced Trading Indicators for Pros
Seasoned traders use advanced trading indicators to capture subtle market nuances and refine their strategies. Here are some of the top tools along with detailed examples and expert insights:
Fibonacci Retracement
- This tool uses key ratios derived from the Fibonacci sequence to identify potential support and resistance levels during market corrections.
- It helps predict how far a price might retrace before continuing in its original direction.
- If a strong uptrend retraces to the 61.8% level, traders might view this as an opportune moment to buy, anticipating a continuation of the uptrend.
- Experts recommend using multiple Fibonacci levels (23.6%, 38.2%, 50%, 61.8%, and 78.6%) in conjunction with other indicators like MACD to create a robust target zone for trade entries and exits.
Ichimoku Cloud
- The Ichimoku Cloud offers a complete picture of the market by combining several indicators into one, displaying trend direction, momentum, and potential support or resistance.
- It gives a holistic view of the market, allowing traders to assess market sentiment at a glance.
- When the price is above the cloud, it typically signals an uptrend; when below, a downtrend is likely.
- Although initially complex, experts suggest practicing with historical data to understand the cloud’s components and using it alongside simpler indicators to confirm trends.
Volume Profile
- Volume Profile visualizes trading volume across different price levels, highlighting areas of significant trading activity.
- It helps identify key trading volume zones that often act as support or resistance.
- A high volume node at a particular price level may indicate strong interest and can serve as a pivotal level for future price movements.
- Advanced traders often combine Volume Profile with VWAP to gain a deeper understanding of price levels where significant trades occur, thereby enhancing their entry and exit strategies.
Average True Range (ATR)
- ATR measures the average range between high and low prices over a period, providing a clear indicator of market volatility.
- It is a must for risk management, as it helps in setting dynamic stop-loss orders and position sizing.
- A rising ATR suggests increasing volatility, prompting traders to widen their stop-losses to avoid premature exits.
- Professionals use ATR to adjust trade size and manage risk effectively; combining ATR with price action analysis leads to more accurate volatility assessments.
-
VWAP (Volume Weighted Average Price)
- VWAP calculates the average price of a security weighted by volume, offering a benchmark for assessing the fair price during the trading session.
- It is widely used by institutional traders to determine the true value of a security in real time.
- If the current price is above VWAP, it may indicate that the asset is trading at a premium, signaling a potential buying opportunity.
- Experts often use VWAP alongside traditional moving averages to fine-tune their entry and exit points, making sure trades are executed at the best possible price.
Having covered both beginner and advanced trading indicators, the next step is to learn how to choose the right trading indicator. This section will guide you on aligning your trading style, market conditions, and asset types with the most effective trade indicators to improve your trading success.
How to Choose the Right Trading Indicator
Selecting the Best Trading Indicators for your strategy involves matching them with your trading style, market conditions, and asset type. Proper indicator selection is key to capturing the true potential of your trades. Consider the following factors:
Trading Style:
- Day Trading: For short-term trades, use indicators that provide real-time analysis, such as those among the best indicators for day trading like MACD, RSI, and Bollinger Bands.
- Swing Trading: Choose tools that capture trend changes over several days, such as Moving Averages or Ichimoku Cloud.
- Long-Term Investing: Rely on indicators that smooth out volatility over time, like a Simple Moving Average (SMA) or an Exponential Moving Average (EMA) with longer periods.
Market Conditions:
- Trending Markets: Indicators such as Moving Averages and MACD work well to identify and follow trends.
- Range-Bound Markets: Tools like RSI and Bollinger Bands are useful for spotting overbought and oversold conditions.
- Volatile Markets: Volatility measures like Average True Range (ATR) help adjust risk management when price swings are larger.
Asset Type:
- Stocks and ETFs: Combine traditional technical indicators (e.g., Moving Averages and MACD) to gain clarity.
- Options Trading: Look for a combination that includes the best indicator for option trading to factor in time decay and volatility.
- Cryptocurrencies: Use a mix of volume-based indicators, such as the best volume indicator, along with momentum oscillators to manage fast price movements.
Expert Advice:
- Avoid Indicator Overload: Using too many trade indicators can result in conflicting signals. It is advisable to select 2-3 complementary indicators that cover different aspects of market analysis.
- Backtesting: Test your chosen combinations on historical data to verify their effectiveness under various conditions. This practice aids in refining your strategy.
- Adaptability: Adjust indicator settings based on the asset and timeframe you are trading. Customization is vital for adapting to changing market conditions.
With a clear strategy for choosing the right tools, let us now explore the Best Trading Platforms with Built-in Indicators that integrate these features seamlessly for an enhanced trading experience.
Best Trading Platforms with Built-in Indicators
A trading platform with built-in indicators can greatly enhance a trader’s experience by offering a comprehensive suite of analytical tools in one place. The following platforms are recognized for their advanced features and reliability:
TradingView
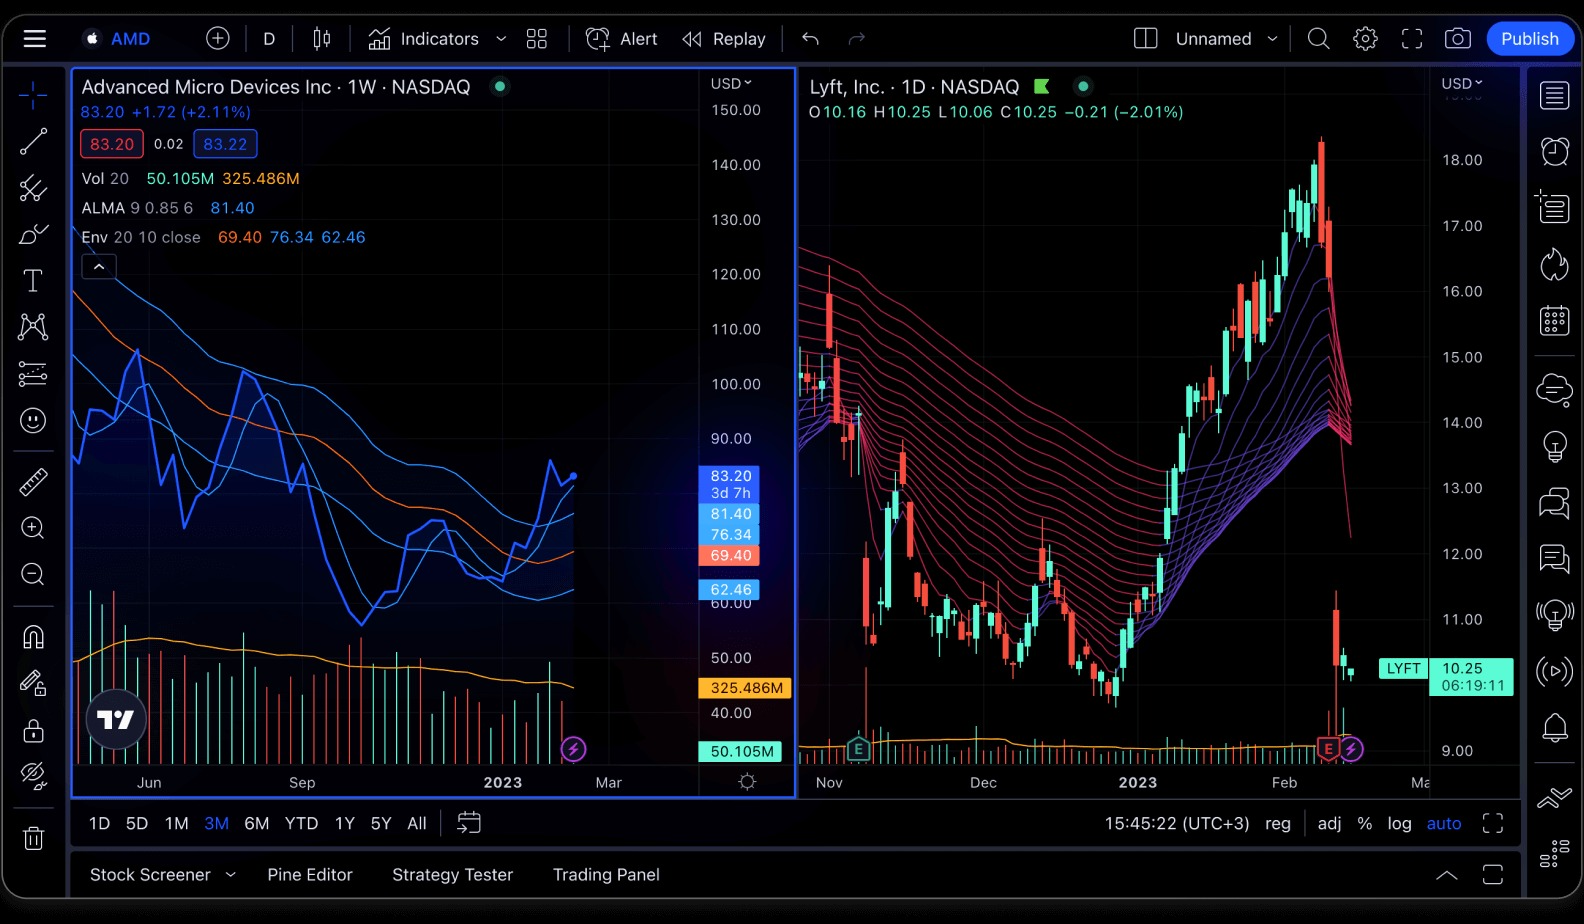
- Features: Offers over 100 built-in technical indicators such as Moving Averages, RSI, MACD, Bollinger Bands, Ichimoku Cloud, Pivot Points, and more.
- Who It Suits: Perfect for traders of all levels who value a visually intuitive interface, robust customization options, and a supportive community for sharing strategies.
MetaTrader 4 & 5
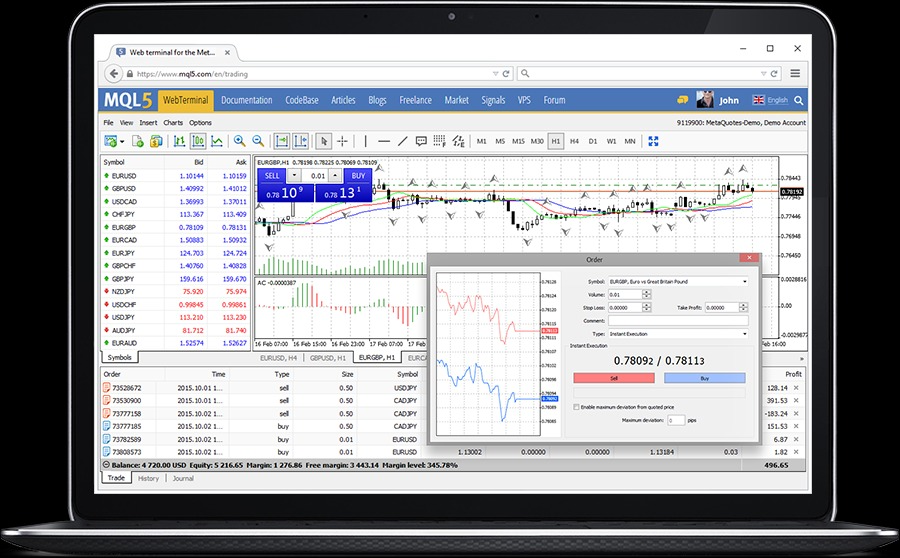
- Features: MT4 and MT5 provide more than 30 built-in indicators including Moving Averages, RSI, MACD, Stochastic Oscillator, Bollinger Bands, and Ichimoku Kinko Hyo.
- Who It Suits: Ideal for forex and CFD traders who favor a highly customizable environment and automated trading support through Expert Advisors.
Binance / KuCoin
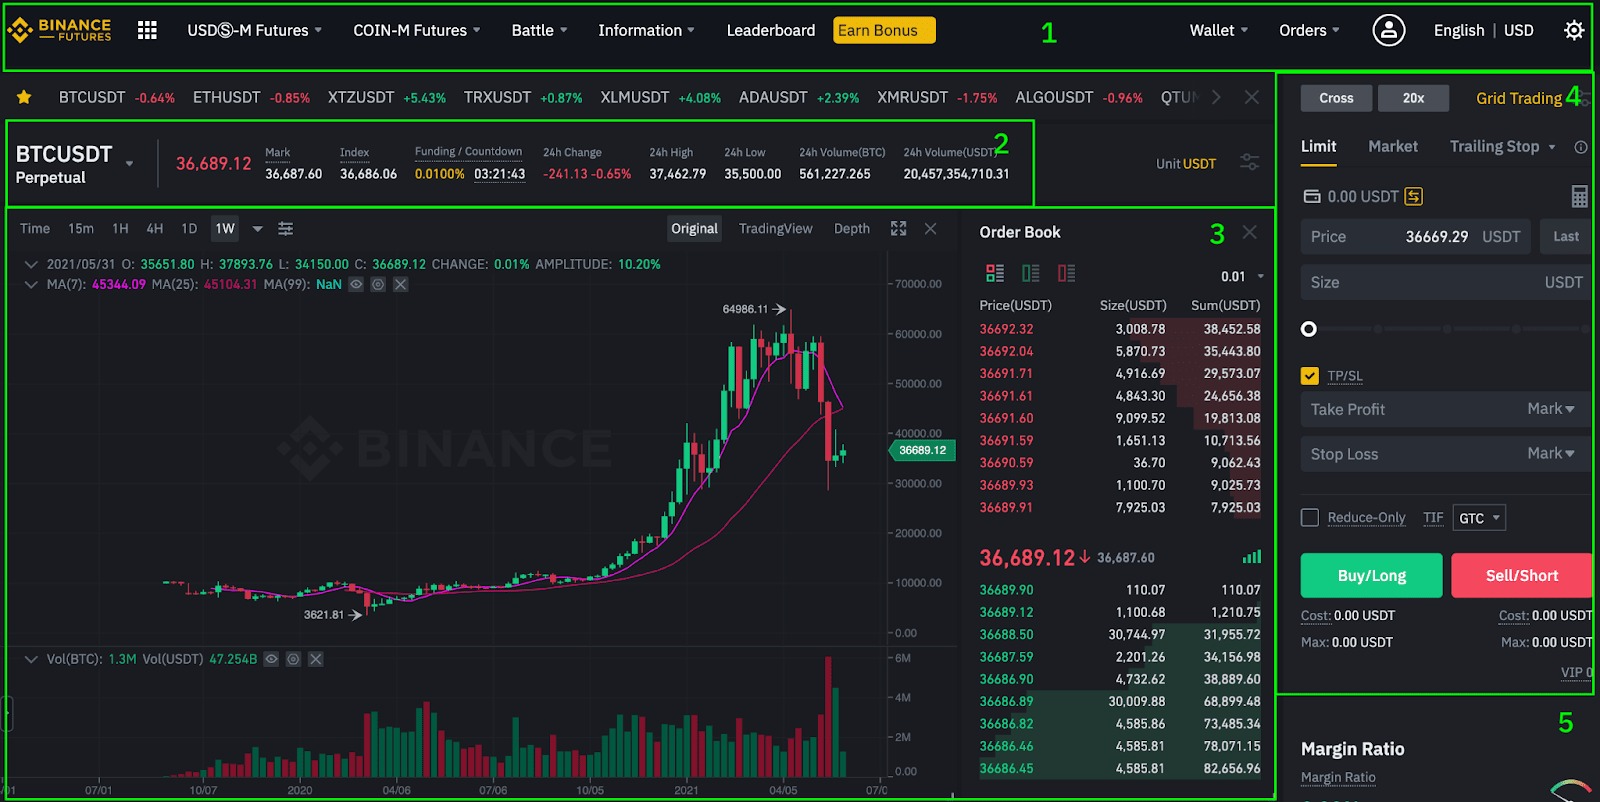
- Features: Integrate a range of technical tools with built-in indicators like Moving Averages, RSI, MACD, Bollinger Bands, and On-Balance Volume (OBV) for cryptocurrency analysis.
- Who They Suit: Best for crypto traders seeking seamless technical analysis directly on their exchange platform for quick and efficient decision-making.
ThinkorSwim
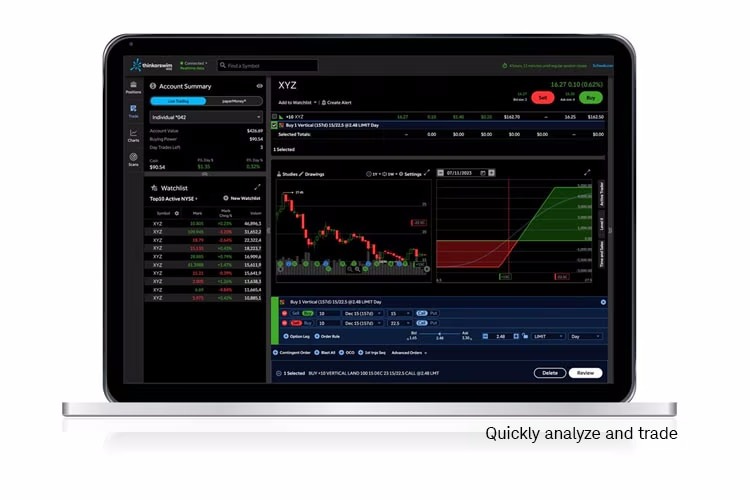
- Features: Equipped with advanced charting tools and a wide array of built-in indicators such as MACD, RSI, Bollinger Bands, Volume, Stochastic, and ATR, along with proprietary studies.
- Who It Suits: Suited for active and options traders who demand real-time data and in-depth analytics to fine-tune their strategies.
NinjaTrader
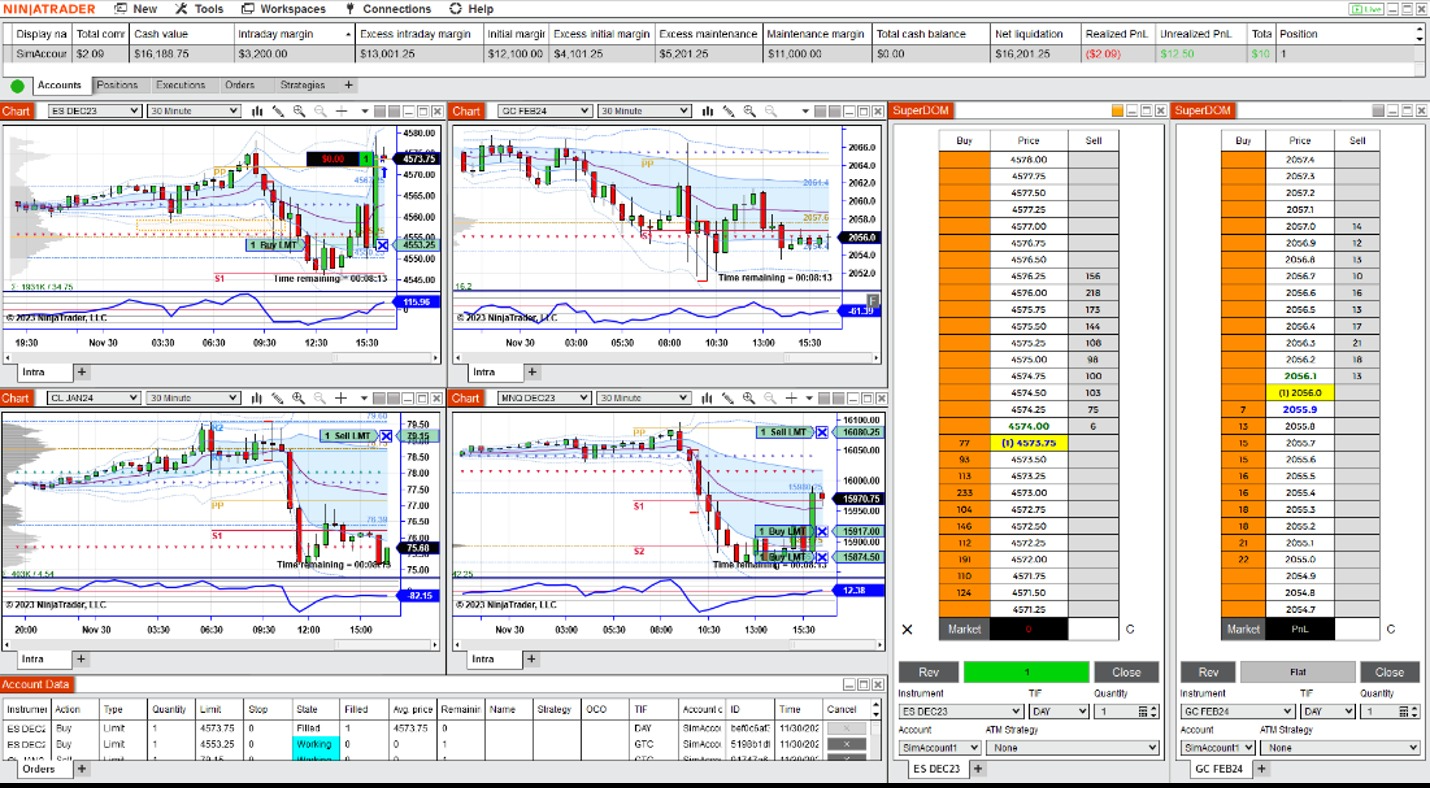
- Features: Offers a comprehensive set of prebuilt indicators including Moving Averages, RSI, MACD, Stochastics, ATR, Pivot Points, and Market Profile.
- Who It Suits: Ideal for day traders and futures traders who require detailed charting capabilities and the flexibility to customize and automate their trading approach.
Let’s say you use the best trading indicator on the best trading platform. If you don’t have a connection, your trades will almost always end in loss. That’s why we offer tailored VPS services for cryptocurrency and Forex traders with our Bitcoin VPS and Forex VPS.
Cloudzy’s VPS services feature 99.95% uptime guarantee, 10 Gbps connections, 24/7 support, 12 locations near market hubs, all at some of the most affordable prices available. So, cut your losses today and start earning with a powerful, affordable, and reliable Cloudzy VPS perfectly designed for trading.
Final Thoughts
Throughout this guide, we have explored both beginner-friendly and advanced trade indicators-each serving a distinct purpose in analyzing price trends, market sentiment, and volatility.
By utilizing tools such as Moving Averages, RSI, and MACD, beginners gain a solid foundation for identifying basic price moves. Advanced traders, on the other hand, benefit from sophisticated indicators like Fibonacci Retracement, Ichimoku Cloud, and Volume Profile to capture subtle market nuances and adjust strategies based on real-time data.
As you continue to experiment and fine-tune your approach, remember that the integration of reliable trading platforms-such as TradingView, MetaTrader, or others mentioned in our guide-can significantly enhance your market analysis. They offer built-in trading indicators that help streamline your analysis and support better decision-making.
Feel free to explore additional resources on our website, such as our comprehensive guide on key chart patterns for more technical insights, and our piece on Fair Value Gap for a more advanced trading strategy.