
PRTG bills by the sensor, one monitored metric on one device, not the device itself. Paessler's own tiers set the working ratio at roughly ten to one: 500 of them cover about 50 devices, 10,000 cover about 1,000. Add a switch stack and start watching throughput per port, and the count moves faster than the estate does. SolarWinds counts differently and arrives at the same place.
For a Windows-heavy network, I would shortlist two self-hosted alternatives to PRTG and SolarWinds: Zabbix, or a Prometheus-based stack if your team already operates one. The choice between them turns on what each one can see on a Windows host, and what it needs in order to see it.
One caveat before any of it. If nobody on the team has spare hours, PRTG and SolarWinds remain the correct answer. Their ease of use is a product you are buying deliberately, and it is worth money. The switch described here spends hours instead of licence fees, and that is a trade, not an upgrade.
TL;DR
- The default is Zabbix. Zabbix puts SNMP polling, Windows agents, templates and alerting inside one monitoring platform. You still operate the Zabbix server, database and web frontend, but you are not assembling separate monitoring components just to get started.
- The exception is a team already running Grafana and Prometheus for application and host metrics. Extending what you already maintain is cheaper than standing up a second monitoring system.
- Prometheus does not poll network devices on its own.
snmp_exporterfills that gap; its default configuration covers many common switches and routers, while vendor-specific objects or customized polling may require the generator and additional MIB work. - Agentless collection sees only what a host or device chooses to publish. In Zabbix, Windows event logs, service state and granular performance counters are agent item keys.
- Size the server by metrics, not devices. Zabbix counts one metric as one item plus one trigger plus one graph, and puts roughly 1,000 metrics on 2 CPU cores and 8 GiB of memory, roughly 10,000 on 4 cores and 16 GiB.
What PRTG and SolarWinds Charge For
Paessler publishes its PRTG tiers publicly, priced by sensor count and billed annually, starting from a few hundred dollars a month as of September 2026. Check the current figures yourself before budgeting. There is no perpetual-licence option in the current lineup. The freeware edition stops at 100 sensors, which Paessler describes as roughly 10 devices.
SolarWinds counts a different unit, and the rule is easy to miss until the renewal quote arrives. SolarWinds' NPM licensing model states that NPM "is licensed according to the largest number of the following types of monitored network elements: Nodes, Interfaces, Volumes." Not the sum. The largest of the three. A network with 80 nodes and 900 monitored switch ports is licensed on the 900, not the 80, and the tiers run SL100 through SLX. A single polling engine caps at 12,000 elements (the sum of nodes, interfaces and volumes, not the largest of them) regardless of tier, after which you add another licensed polling engine.
The practical effect of both models is the same. The licence tier decides what gets monitored. The network does not. Interfaces you would like to watch stay unwatched because watching them crosses a boundary, and that cost never appears on the invoice.
The Two Self-Hosted Paths Worth Running
Zabbix is one monitoring platform built around a central server, database and web frontend. The server polls SNMP devices, receives data from Windows agents, and applies templates, triggers and alerting within the same product. Compared with assembling a Prometheus-based network-monitoring stack, there are fewer separate components to integrate yourself. You install it, point it at hosts, and attach templates, which are reusable bundles of items, triggers and graphs covering one class of device.
Start with the licensing. Zabbix's license page states that every version from 7.0 onward is released under the GNU Affero General Public License version 3, and that everything up to 6.4 was GPLv2. There is no licence fee for the software at any scale. Zabbix sells technical support as a separate optional subscription, and asks commercial users to buy some level of it, but nothing in the product is gated behind that purchase.
The second path is Grafana, Prometheus and VictoriaMetrics. It is the right choice for exactly one situation: you already run this stack for application and host metrics, and someone already maintains it. If that is you, the full build on a single VPS is a solved problem and you are extending something familiar. Nobody has to learn a new data model.
The gap on that path is network devices. Prometheus scrapes HTTP endpoints; it does not speak SNMP directly. Network gear is normally handled through snmp_exporter, which polls the device and exposes the results for Prometheus to scrape. Its default configuration includes modules such as if_mib, so standard interface monitoring on many switches and routers does not require generating a custom configuration. The generator becomes extra work when you need vendor-specific objects, customized walks or MIBs that are not included by default. The Prometheus path therefore has more pieces to maintain than Zabbix, but the generator is not mandatory for every device.
LibreNMS is the third name in this space, built around automatic discovery: it walks a network over SNMP, CDP, LLDP, OSPF, BGP and ARP to find what is there. It is a reasonable option when discovery is the priority. It does not change the Windows collection question, which is where this decision is settled.
How Each Path Sees a Windows Host
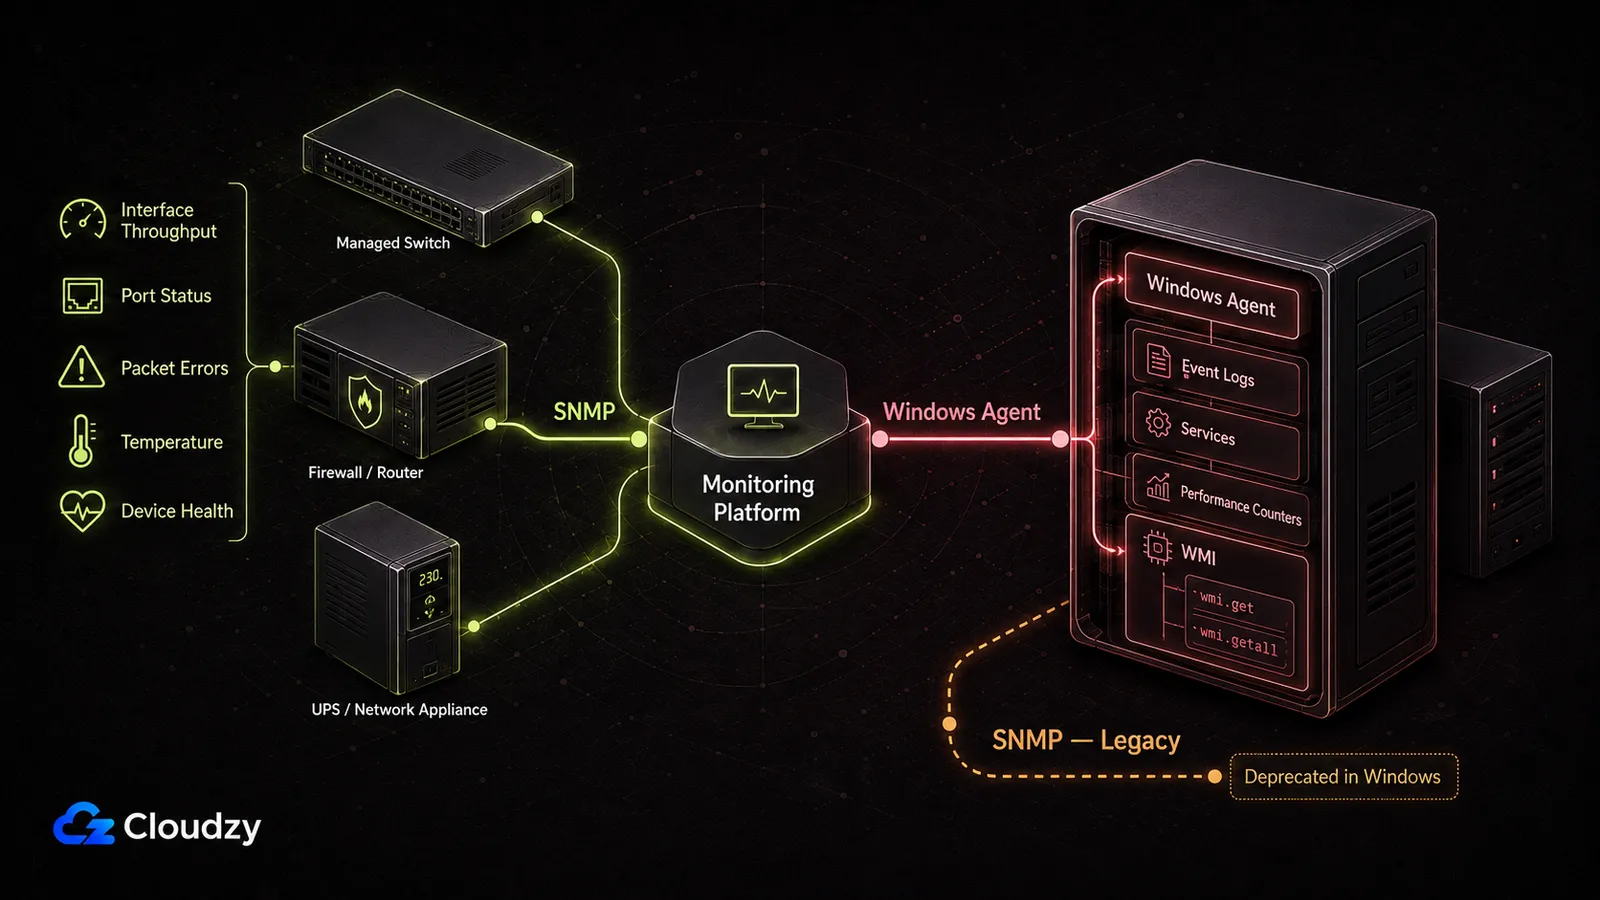
Windows monitoring can involve SNMP, remote WMI or an installed agent. Which path applies depends on the monitoring product and the metric being collected. In Zabbix specifically, the built-in WMI checks run through the Windows agent.
SNMP
An SNMP poll asks a device for the current value of a numbered object, addressed by an OID, which is a position in the device's MIB. What comes back is whatever the device publishes and nothing else. On a managed switch, a firewall or a UPS, that is usually enough: interface counters, port status, error rates, temperature, chassis health.
On Windows the picture is thinner. Microsoft's deprecation notice for SNMP and WMI SNMP Provider confirms that both features are deprecated, so I would treat Windows SNMP as a legacy compatibility path rather than the default for a new deployment. Zabbix still provides a Windows by SNMP template, but the native agent gives you considerably more visibility into the operating system.
WMI
WMI can be queried remotely without installing a monitoring agent on the target, which is why products such as PRTG can use it as an agentless Windows collection method. Zabbix works differently. Its built-in WMI checks, wmi.get and wmi.getall, are Windows-agent item keys, so the Zabbix agent or agent 2 performs those queries on the monitored machine.
Remote WMI also brings its own network requirements when a monitoring product uses it directly. On current Windows systems, RPC starts on TCP port 135 and normally negotiates connections through the dynamic high TCP port range, typically 49152 through 65535. The firewall and WMI permissions on the target must allow the connection.
For this comparison, the distinction is more important than the protocol itself: PRTG can use remote WMI without an installed monitoring agent, while Zabbix gets its Windows-specific WMI visibility through its agent.
The Native Agent
The agent is where the Windows-specific depth lives. Zabbix's documentation lists the Windows-specific keys: eventlog for Windows event log monitoring, perf_counter for any Windows performance counter, service.discovery and service.info for service state. All of them are agent item keys.
The cost is deployment. An agent on every Windows Server and every workstation you care about is a package to push, a version to keep current, and a firewall rule to maintain. That is a standing operational commitment, and it is the counterweight to the licence saving.
Agentless collection is bounded by what the host or device chooses to publish, and in Zabbix the event logs and granular performance counters sit behind agent item keys.
Side by Side
The comparison turns on four things: whether the tool polls network devices over SNMP at all, whether it has a Windows agent, how deep it can see into a Windows host, and how much assembly stands between you and a working system. Licensing sits alongside those because it is why the evaluation started.
| Tool | SNMP device polling | Windows monitoring | Setup effort | Licensing |
|---|---|---|---|---|
| Zabbix | Built in | Agent: event logs, service state, performance counters and WMI; coarse state over SNMP | Moderate: one server, then templates | AGPLv3, no licence fee; support sold separately |
Grafana + Prometheus + VictoriaMetrics (+ snmp_exporter) | Not built in; needs snmp_exporter as a separate component | No native Windows agent; host metrics come from separate exporters; event logs are not native | High: multiple components; custom SNMP may require generator work | Open source components, no licence fee |
| Uptime and status monitors | None | Service reachability and response time only | Low: minutes | Varies by tool |
If the requirement is "tell me within a minute when a service stops responding," an uptime monitor is the correct size of tool and the other two are overbuilt for it. What it will not do is poll a switch for interface throughput or read a Windows performance counter, so it is not a replacement for PRTG or SolarWinds. It is a different job that is sometimes mistaken for the same one.
Which One to Run
Run Zabbix. For a Windows-heavy network with no existing Prometheus investment, it is the shorter path by a wide margin. You still have a server, database and web frontend to operate, but the monitoring model, templates and alerting live inside one product instead of being assembled across several monitoring components.
For a long-lived monitoring deployment, use the current Zabbix LTS branch rather than a short-term standard release. Zabbix's LTS lifecycle gives each release three years of full support followed by two years of limited support, which matters more here than chasing the newest feature release.
The exception is narrow and specific. If your team already runs Grafana and Prometheus in production for application and host metrics, and someone already owns that stack, then snmp_exporter is an addition to something maintained rather than a second system to maintain. That condition is conjunctive: both halves have to hold. An abandoned Grafana instance that one person set up last year does not qualify.
And if nobody has the hours, renew. That is not a hedge. It is a different situation with a different correct answer. The switch converts a licensing bill into an operational one: agent rollouts, template work, upgrades, and someone who understands the system well enough to fix it at 2am. A team already at capacity will do that work badly or not at all, and unmaintained monitoring is worse than expensive monitoring because it fails quietly.
The hybrid is real: keep the incumbent on a shrinking core of critical systems, move everything else to Zabbix, and let the licence tier fall over time. It works. It also means running two monitoring systems and reconciling their alerts, so treat it as a transition state with an end date.
What Doesn't Survive the Move
Zabbix's own migration guide has a section headed "What is NOT migrated," and the list is longer than the word "migration" implies. Historical data and sensor readings do not come across. Custom PRTG notifications and dependencies do not. Maps and dashboards do not, because the two products model them differently enough that rebuilding beats translating. The sensors themselves do not, since Zabbix works with a different concept entirely.
Device names, IP addresses and interface types can be carried over. Even that goes through custom export and import scripting against both APIs. The guide states plainly that there is no official tool to migrate directly between the two platforms.
One team documented what that costs in practice: roughly 500 VMs and physical servers, about seven years on PRTG, rebuilt from nothing over six months of low-priority project time. Their 2,500 PRTG sensors became 43,000 Zabbix items, which is a plain illustration of how differently the two systems count.
"Start from scratch. There's no 'Press this button and migrate' option available to migrate from PRTG to Zabbix and even if there were, something like this is a good chance not to repeat previous design mistakes."
That is one organisation's experience, not a benchmark. A smaller estate will not produce those numbers. What transfers is the planning assumption: budget rebuild time, not migration time.
Sequence the rebuild against what you cannot be without. If your concern is continuity of alerting, rebuild the notification rules first and let the dashboards lag behind. If it is reporting history, export what you need before the old licence lapses. It will not come with you.
Sizing the Server
Zabbix's hardware requirements put a small installation of about 1,000 monitored metrics on 2 CPU cores and 8 GiB of memory, and a medium installation of about 10,000 metrics on 4 cores and 16 GiB. Those are the figures to requisition against.
The unit is where sizing goes wrong. Zabbix defines one monitored metric as one item plus one trigger plus one graph. A metric is not a device and it is not a host. A single Windows Server contributes as many metrics as you configure items for: CPU, memory, each filesystem, each service, each counter you sample. A device count is a poor guide to the box you need. An estate that sounds small can land in the medium band without anyone doing anything unusual.
Two things push the number up faster than host count does. Polling frequency is the first: halving a refresh interval doubles the write rate for every item on that interval. History retention is the second, since the database grows with how long you keep raw values. Device count matters mainly through the number of monitored items each device contributes.
If your estate stays near the 1,000-metric example with ordinary refresh intervals and modest retention, the small band is a reasonable starting point. If you are sampling performance counters every thirty seconds and keeping a year of raw history, it does not. Zabbix is explicit that its published figures are "size and hardware configuration examples to start with," and recommends benchmarking in a staging environment before committing production hardware. That is the vendor's own caveat. Take it literally.
Zabbix supports its server component on Linux and UNIX only; on Windows, only the agent is supported.
Metrics are not devices, and the multiplier between them is what determines the size of the box.

Build on a Linux VPS with root access, NVMe, and AMD EPYC power.
View Linux PlansWhere to Put the Monitoring Server
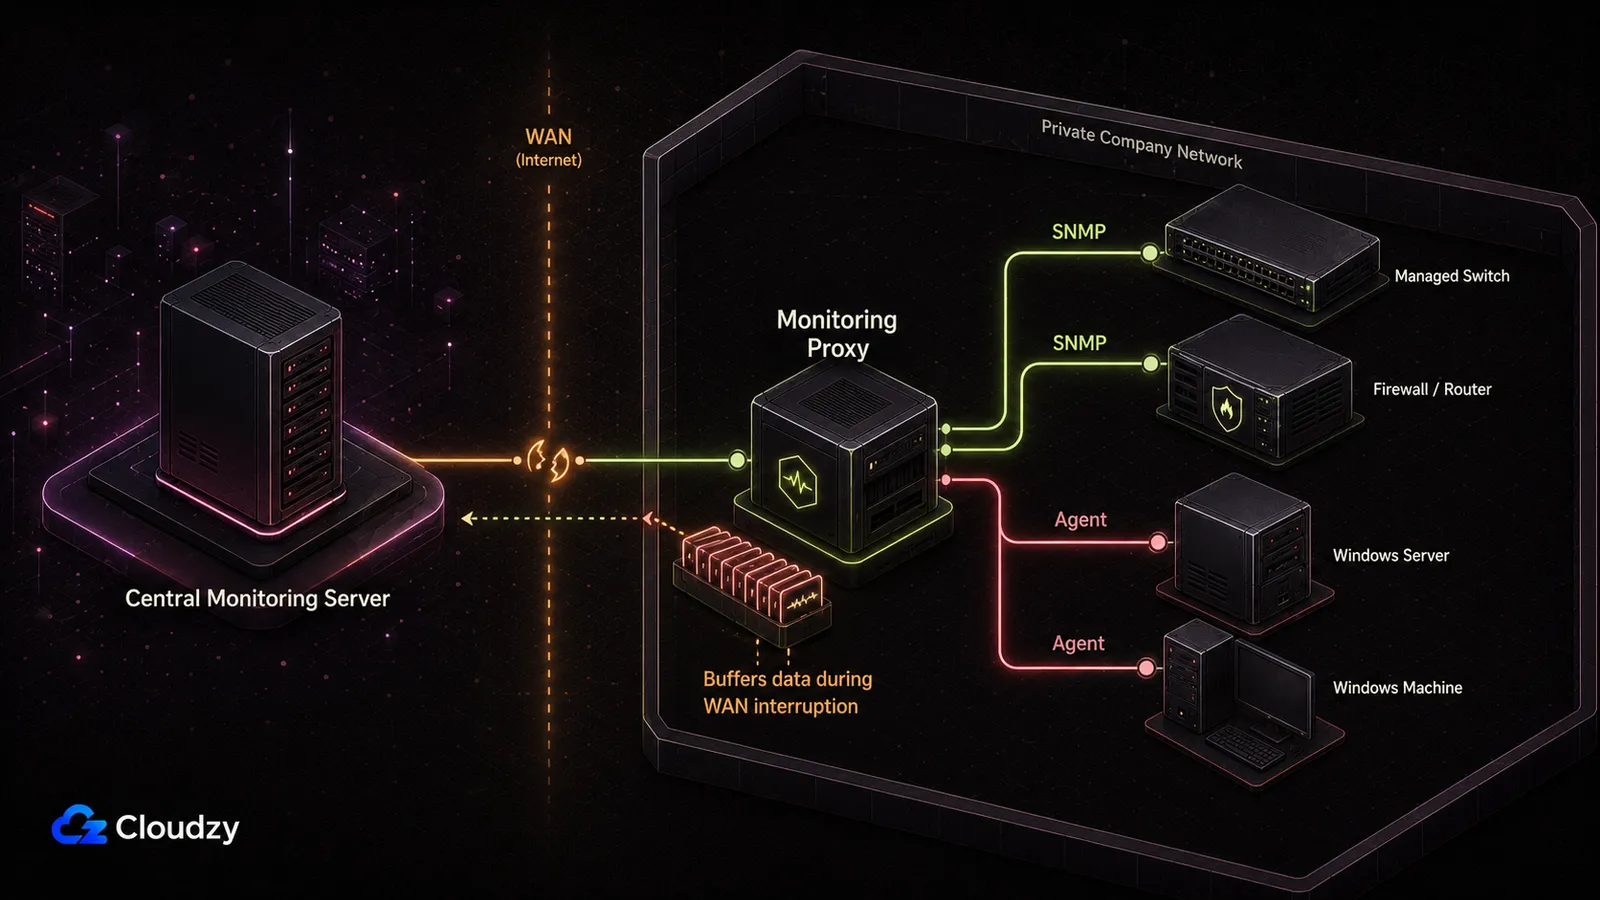
If you need monitoring to survive a site-wide outage, keep the central Zabbix server outside the site's failure domain. Losing the site's uplink can then take the monitored network offline without taking the monitoring server down with it.
For a private network, a Zabbix proxy can sit inside the site and collect from the systems around it. The proxy can handle SNMP and agent checks locally, send the collected data back to the central server, and buffer monitoring data while connectivity between the two is unavailable. That lets the central server stay outside the site without requiring every private switch, firewall and Windows host to be directly reachable from the internet.
A VPS is one practical place to run that central server. Cloudzy offers Zabbix Server as a one-click deployment on Ubuntu Server 24.04 LTS if you want to skip the initial installation and move straight to configuring hosts and templates.
Frequently Asked Questions
Is Zabbix Really Free?
Yes. Zabbix is released under the GNU Affero General Public License version 3 from version 7.0 onward, and there is no licence fee for the software regardless of how many devices or metrics you monitor. Zabbix sells technical support as a separate optional subscription, but no feature of the product is locked behind it. The cost of running Zabbix is the server it runs on and the hours you spend operating it.
Do I Need to Install an Agent on Every Windows Server?
Not on every Windows machine, but if you want Zabbix's native Windows monitoring depth, plan to install the agent on the servers you care about most. SNMP can provide coarse agentless data, although Microsoft's Windows SNMP feature is deprecated. Zabbix's built-in WMI checks also run through its Windows agent, so WMI is not a direct agentless collection path in Zabbix. Use the agent for event logs, service discovery, WMI queries and granular performance counters; keep agentless SNMP mainly for network hardware and legacy Windows cases.
Can I Run the Monitoring Server on Windows?
Not with Zabbix. Zabbix's requirements documentation lists the server component as supported on Linux and other UNIX platforms only, and states that "UNIX is the only operating system that can consistently deliver the necessary performance, fault tolerance, and resilience." Windows support covers the Zabbix agent and agent 2, which are what you install on the machines being monitored. The monitoring server sits on a Linux host; the Windows estate is what it watches.
Does Prometheus Do SNMP Monitoring?
Not on its own. Prometheus scrapes HTTP endpoints and uses snmp_exporter to collect from SNMP devices. Its default configuration covers many common switches and routers, while vendor-specific objects or customized polling may require additional MIB configuration and the generator.

Discussion
Comments
Sign in to join the discussion.