

Something you built is in production. Your monitoring is either nothing at all or an uptime ping, and last week you found out about an outage from a user. Every answer you go looking for points at the same name.
This Prometheus review is about the gap between two things that are both true. It's free and open source, with no license or per-metric bill attached at any scale. It also costs you an evening plus a query language you don't know yet. It's a pull-based metrics collector with alerting attached, and it's an excellent piece of software. Whether it's the right piece of software for the setup you're running right now is a different question, and that's the one worth answering.
The Short Version
- Verdict: 3.5 / 5 for solo and small-team self-hosting. Prometheus is worth running if your set of hosts and services is reasonably stable, you'll put in the time to learn PromQL, and you want metrics you own outright with no subscription and no retention bill.
- Skip it if the question you need answered is "is it up." An uptime checker gets you there far faster, and reaching for Prometheus to do that job means paying for a query language to answer something you could have answered in ten minutes.
- PromQL is the cost that keeps recurring. Setting it up is a one-time cost. Once your questions outgrow canned dashboards and Grafana's visual builder, you're back in PromQL.
- Maintenance cost tracks how much of the setup you manage by hand. A fleet that keeps its shape is cheap to monitor. One that gains, loses, and renames hosts is where the cost quietly compounds.
- This verdict is scoped to small-scale self-hosting. At Kubernetes and production-SRE scale Prometheus is a different proposition, and this review doesn't try to answer that one.
How this review was put together: Prometheus is free and open source, so there's no vendor relationship here and nobody sent me anything. The version facts and storage behavior come from Prometheus's own documentation. The resource numbers and setup times come from two independently published hands-on tests, credited at the point where each one is used. Where those two disagree, you'll see both figures instead of an average.
What This Review Covers
The verdict above is bounded, and the boundaries matter more than usual here, because Prometheus behaves like a different tool at different scales.
- Prometheus evaluated for single-VPS and small-project self-hosting: a handful of hosts and services, one person looking after them.
- Not Kubernetes. Prometheus Operator, ServiceMonitors, and the kube-prometheus-stack are a separate operational world, and the verdict here says nothing about that one.
- Not an Alertmanager routing guide. Alerting exists and works; configuring routes, silences, and receivers is a subject of its own.
- Not an installation walkthrough. The question here is whether to run it at all. If you have already answered that one, our Grafana and Prometheus Docker Compose guide covers the steps.
- Not an exporter survey. Exporters come up only where they change the answer.
What Prometheus Gets Right
Prometheus costs nothing. Not "free tier with paid upgrades," not "free until you cross a metric limit." The repository is Apache 2.0 licensed end to end, there is no paid tier for the core project, and there is no per-host, per-metric, or per-label billing anywhere in it. The only bill Prometheus ever generates is the server it runs on.
For something you're planning to depend on, "will this still be here in three years" is a fair question to ask, and here the odds are about as good as open source gets. Prometheus graduated from the CNCF in August 2018, the second project ever to do so, after Kubernetes. Releases are steady, with v3.13.2 landing at the end of July 2026, and because that release line is a long-term-support line, it gets bug, security, and documentation fixes for a year, so staying patched doesn't mean chasing every minor version.
The data model is why the ecosystem around it runs so deep. Prometheus scrapes metrics over HTTP and identifies every series by a metric name plus key/value labels, which makes writing an exporter a small job. So exporters exist for almost anything you'd plausibly run: node metrics, Postgres, Nginx, Redis, blackbox probes for the things you can only poke from outside.
And you own what it collects, which is the part that tends to matter later rather than on day one. A small setup's history takes an unremarkable amount of disk (numbers below), nobody can reprice it on you next quarter, and there's no line item that grows every time someone adds instrumentation to an app. If you've ever watched a managed monitoring bill climb because a developer added one label, that's the whole argument in a sentence.
Where Prometheus Costs You More Than It Looks
A dev.to test of seven monitoring tools on one small VPS measured Prometheus alone at 15 minutes to set up. Pair it with Grafana, as that tester did, because the built-in expression browser is only a place to run queries. The same test put Grafana + Prometheus at 35 minutes to a first chart, with YAML scrape configuration in the middle.
The minutes are the cheap part. PromQL is the expensive one. Prometheus stores everything as time series identified by name and labels, and PromQL is still the language underneath the questions you ask it. Grafana has a visual builder now, so you don't have to hand-write every query. The tester's own verdict was blunt: PromQL is wonderful if you live in it, and they didn't. If you've never used a query language before, budget more than one evening for that, and expect to come back to it whenever the visual builder stops being enough. A dashboard you copied from someone else answers their questions. Yours are a query you haven't written yet.
The third cost is the one that doesn't show up until later. One operator's three-week write-up describes exactly what adding a single server to a seven-node setup involved: re-labelling, re-checking scrape configs, editing dashboard variables, and reworking template queries so the new host would show up in the dropdowns. That operator gave up on the stack after three weeks, having concluded they were spending more time tuning dashboards than watching the infrastructure.
Notice what that cost is tied to in this kind of setup: targets and dashboards being managed by hand. Running Prometheus for two quiet years costs you almost nothing extra.
How Much RAM and Disk Does Prometheus Actually Need?
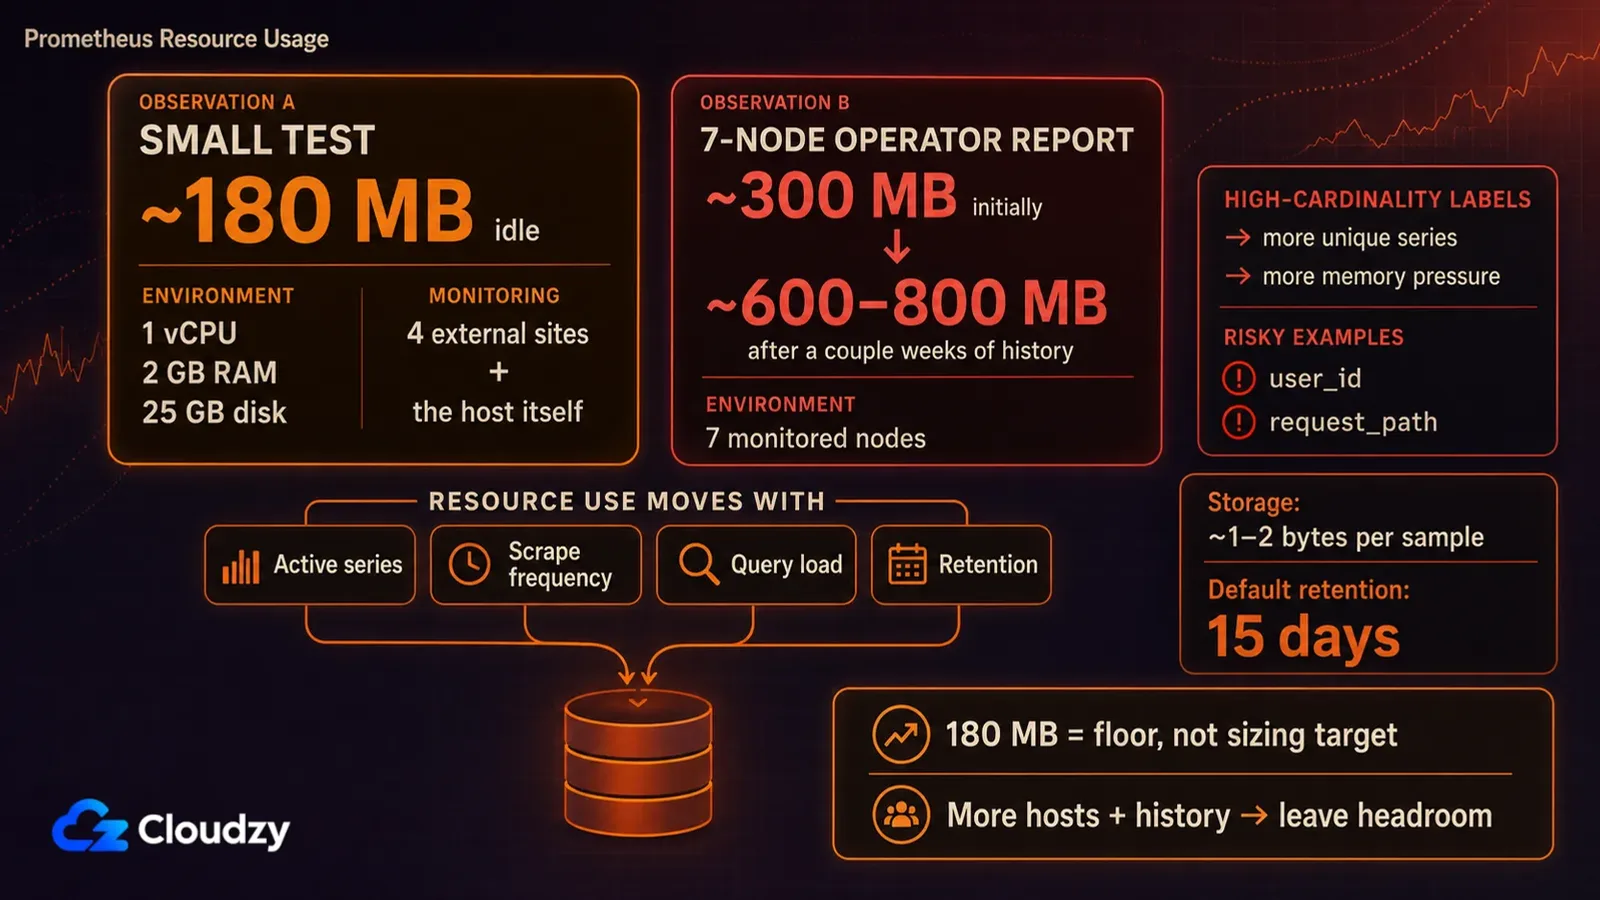
There's no fixed requirement. Active series, scrape frequency, query load, and retention matter more than the raw number of servers you point it at. Two published hands-on tests of small setups put it between roughly 180 MB and 800 MB, the higher figure covering seven nodes with a couple of weeks of history.
The two tests disagree, and the disagreement is the useful part. The same seven-tool VPS comparison ran every tool on identical hardware (1 vCPU, 2 GB RAM, 25 GB disk, Ubuntu 24.04) watching four external sites plus the host itself, and measured Prometheus at about 180 MB idle. The same operator reported Prometheus alone idling around 300 MB on the central host, climbing toward 600 to 800 MB once a couple of weeks of history had piled up.
Those are not the same measurement, which is why averaging them would throw the information away. One is a near-idle reading on a box with very little to store. The other is a working deployment with a fleet behind it and history on disk. My read: treat the 180 MB result as a floor, not a sizing target. Once you're collecting from multiple hosts and keeping history, leave headroom instead of planning to that idle number.
Disk is the easy half. Prometheus's storage documentation puts it at an average of 1 to 2 bytes per sample, so keeping a long history for a small setup is cheap. The catch is the default: retention defaults to 15 days unless you set a retention time or a retention size. That's one startup flag away from being a year, and it's the kind of default you'd rather learn about now than the first time you go looking for last month's numbers and find they aged out three weeks ago.
What drives the memory figure up is cardinality: the count of distinct time series, where every unique combination of labels on a metric becomes its own series. One badly chosen label on a high-traffic metric can create more series than five extra servers ever would, and it does it silently, at whatever rate your traffic happens to be running. (A user ID or a request path looks like a great label right up until you count how many of them there are.)
Any RAM number you find quoted for Prometheus is only usable if you also know how many series were sitting behind it.
What Happens When Your Prometheus Server Goes Down?
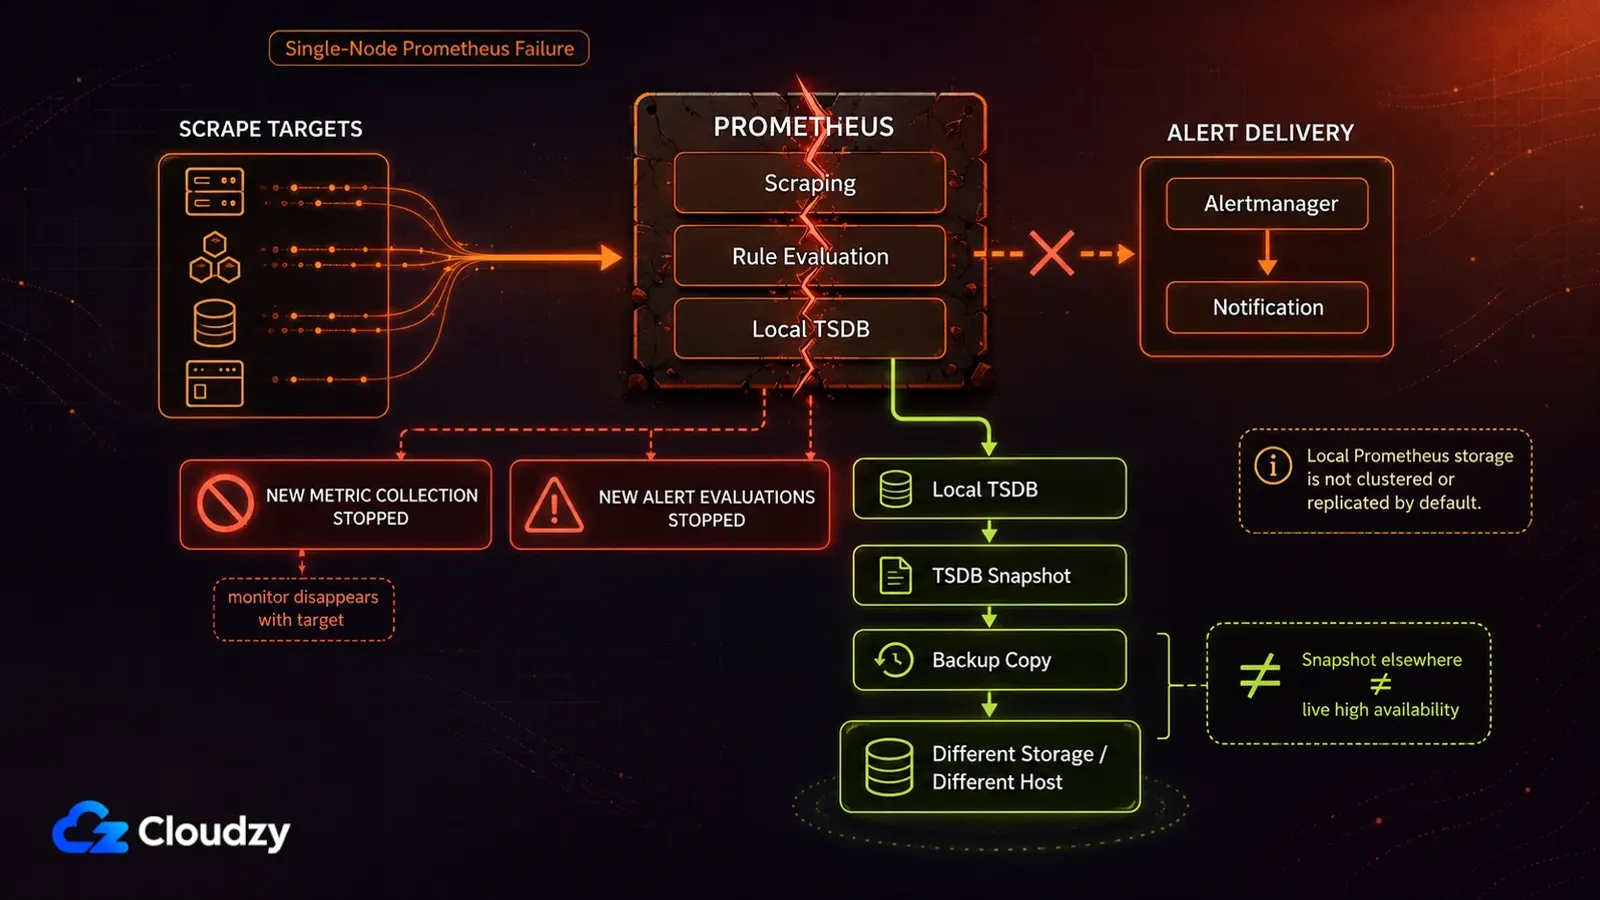
Prometheus's own storage documentation is direct about this: local storage is not clustered or replicated, so it isn't durable against a drive or node failure. Each server is standalone by design and depends on no network storage and no remote services, which is precisely what makes it easy to run and precisely what leaves it exposed.
At solo scale that turns into two problems. If the box holding Prometheus dies, new alert evaluations stop, and your history goes with it unless you were taking TSDB snapshots and managing it like the single-node database it is, taking TSDB snapshots and copying them somewhere else. And if that box is also one of the machines being monitored, which on a one-server setup it inevitably is, then the thing that tells you something broke is the same thing that broke. (Yes, that's about as useful as it sounds.)
There's a second boundary the project states about itself, and it deserves credit for stating it: if you need 100% accuracy, such as for per-request billing, the documentation says Prometheus is the wrong choice, because the data it collects likely won't be detailed and complete enough. Use something else for the numbers you invoice on and keep Prometheus for monitoring. Vendors don't usually volunteer that kind of thing about themselves.
There are established answers to this at larger scale, and they're out of scope here for the same reason the Kubernetes tooling is: a different operational commitment than the one this review covers. For a single VPS, my read is that the exposure is acceptable if you keep TSDB snapshots somewhere else or accept upfront that you'll lose the history, and it's a genuine problem if Prometheus is the only thing standing between you and a silent outage.
Who Should Self-Host Prometheus?
The clearest signal that Prometheus will repay what it costs has nothing to do with how many servers you have. It's whether they'll be the same servers in six months. A stable set of manually configured hosts means you write the configuration once and collect history for free; one that keeps changing means you keep touching that configuration.
In a static setup, your Prometheus and Grafana configuration is an explicit description of your infrastructure: scrape targets, the labels attached to them, and dashboards built on top of those labels. That's why history is the whole payoff. A year of data on a stable set of hosts tells you what normal looks like, which is the most reliable way to recognize abnormal before it turns into an outage.
So the first profile is someone running a small, slowly-changing set of servers who wants more than up or down: request latency over time, memory trends, a disk filling gradually enough that you can see it coming weeks out. If you can describe your infrastructure today and expect that description to be roughly true a year from now, the evening you spend on setup is the last big bill.
The second is anyone learning this stack deliberately. If you expect to be running infrastructure a few years from now, yours or someone else's, the PromQL evening is the thing you came for and the monitoring is a side effect. This profile partly inverts the first one: the stability test matters less here, because time spent re-labelling is also time spent learning what re-labelling is. For this reader I'd move the rating up.
The third profile is about ownership, and it's the one people underrate until they've been on the wrong side of it. Prometheus doesn't bill per host, per metric, or per label, and no pricing page can change underneath you next quarter. The trade against a managed service like Datadog: you give up the polish, the support contract, and someone else's on-call, and in exchange you get metrics that are yours on a bill that doesn't move when a developer adds instrumentation. Whether that's a good trade comes down to what your own hours are worth, which is a number only you can put in (and it's rarely zero, even when it feels like it).
One thing to know before you commit: outgrowing Prometheus's local storage isn't a dead end. VictoriaMetrics accepts Prometheus remote writes, and its MetricsQL is backward-compatible with PromQL, so most of the queries and Grafana dashboards you build now should survive the move. It's a migration, not a rewrite.
Worth re-checking once a year rather than deciding once: the setup that's cheap to monitor today gets expensive the quarter you start rebuilding it.

Build on a Linux VPS with root access, NVMe, and AMD EPYC power.
View Linux PlansWho Should Skip Prometheus?
If the sentence you'd use to describe what you need is "tell me when the site goes down," you're describing an uptime checker, and Prometheus is a lot of machinery to get to that answer. Uptime Kuma does that specific job with a web UI and doesn't ask you to learn a monitoring query language. The capability gap between the two tools is enormous and completely irrelevant to the job you're hiring for.
The second reader is the one who wants usable graphs without learning a query language first. Netdata is built around exactly that: per-host metrics you can look at immediately, with far less configuration and nothing standing between you and the charts. If the question you keep asking is "why is this box slow right now," that's a much shorter route to an answer.
The third is anyone whose infrastructure changes shape often and who is managing targets and dashboard variables by hand. Hosts spun up for a week and destroyed, targets renamed, projects renamed halfway through. That's the case where you pay the configuration cost over and over while getting the least benefit from the thing you're paying for, which is continuous history of a system that stays recognizable.
None of this is a knock on the tool. "Skip it" here means skip it for this job, at this scale. At Kubernetes scale, where service discovery handles most of what you'd otherwise wire up by hand, several of the costs above shrink or disappear entirely, and my read of that scale is that Prometheus is very hard to beat on it. That's a different review.
Frequently Asked Questions
Is Prometheus Free?
Yes, and there's no free-tier catch underneath it. Prometheus is Apache 2.0 licensed with no commercial edition sitting behind it, so there's no metric quota to cross and no upgrade prompt waiting on the other side of one. You pay for the infrastructure and your own time, not a Prometheus license.
Does Prometheus Need Grafana?
No, but plan on it. Prometheus's own expression browser exists to run a query and look at the answer, which covers checking one thing once. Anything you want to leave open on a second monitor is Grafana's job, and the two are almost always run together.
Is Prometheus Overkill for a Single Server?
Often, yes. If what you need is to know whether the server and its services are up, an uptime checker answers that in a fraction of the setup time. Prometheus earns its place when you want historical metrics you can query, and you're willing to learn PromQL to get at them.
How Long Does Prometheus Keep Metrics by Default?
15 days, and it doesn't warn you first. Prometheus drops samples older than the retention window unless you raise it with a retention time or a retention size flag at startup. Set it the day you install, because raising the window later won't bring back data that already aged out.



Discussion
Comments
Sign in to join the discussion.