
Uptime Kuma is an open-source, self-hosted monitor for HTTP(S), TCP, ping, DNS, WebSocket and other checks. On a separate VPS, it keeps checking when your production server fails instead of disappearing with it.
This Uptime Kuma VPS setup deploys v2 with Docker Compose, keeps port 3001 on loopback, adds HTTPS through Caddy, routes alerts to Telegram, Discord and Slack, and publishes a status page.
Prerequisites and What You Will Need
- A VPS with at least 1 vCPU, 1 GB RAM, and 10 GB of local SSD storage
- Ubuntu 24.04 LTS or another current Ubuntu release supported by Docker
- Docker Engine and Docker Compose installed on the VPS
- A domain or subdomain pointed at the VPS via an A record (something like status.example.com)
- SSH access and basic comfort with the command line
If Docker is not installed yet, follow Docker's Ubuntu installation guide. It installs Docker Engine and the Compose plugin used below.
Why the Monitoring VPS Must Be Separate From the Things It Monitors
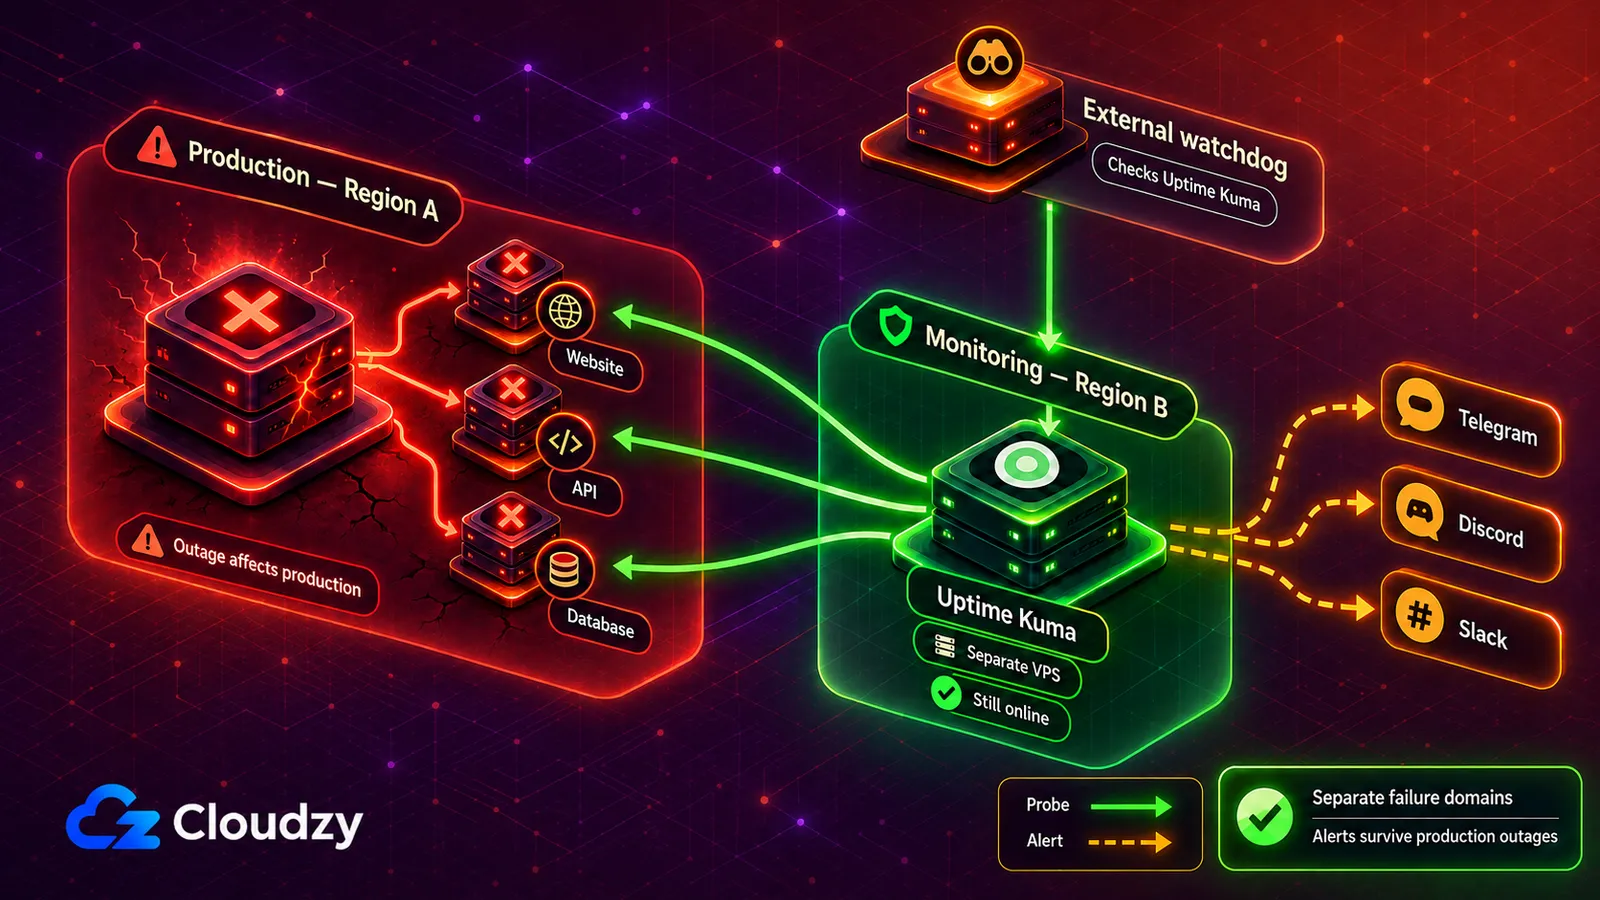
Production and monitoring on the same server share the same failure domain. If that server stops, both the application and the system responsible for sending its alert disappear.
Two practical layouts improve this:
- Same provider, different location. Put production and monitoring on separate hosts in different locations. This reduces exposure to a single-server or single-datacenter failure, but it does not protect against every provider-wide network or control-plane incident.
- Different provider entirely. Hosting the monitor elsewhere adds protection against provider-wide incidents. The trade-off is another account, invoice and operational surface to manage.
A single Uptime Kuma instance still has no outside watchdog. Add one external HTTP(S) check for its public status page. UptimeRobot's free plan currently includes 50 monitors at five-minute intervals. This will not make Uptime Kuma highly available, but it will tell you when the monitor itself disappears.
The same rule applies to public status pages: the thing that tells you about failure must not share a failure domain with the thing that fails.

Build on a Linux VPS with root access, NVMe, and AMD EPYC power.
View Linux PlansVPS Sizing
Uptime Kuma does not have a reliable monitor-count-to-RAM formula because the workload changes with monitor type, interval, retry settings and history retention. Simple HTTP(S), TCP, ping and DNS checks are lighter than Browser Engine checks, which run Chromium.
For a small set of basic checks, start with 1 vCPU, 1 GB RAM and local SSD storage. Watch actual use with docker stats uptime-kuma and database growth with du -sh /opt/uptime-kuma/data. Add memory when usage stays high, the container reports an OOM kill, or you introduce Browser Engine checks.
The full v2 image includes Chromium and embedded MariaDB; the Docker tag documentation explains the difference between the full and slim images.
Deploy Uptime Kuma With Docker Compose
Save this file as docker-compose.yml in /opt/uptime-kuma/:
services:
  uptime-kuma:
    image: louislam/uptime-kuma:2
    container_name: uptime-kuma
    restart: unless-stopped
    ports:
      # Bind to localhost only. The reverse proxy will expose it on 443.
      - "127.0.0.1:3001:3001"
    volumes:
      - ./data:/app/data
Three lines worth pointing at:
- image: louislam/uptime-kuma:2 pins the major version. The :2 tag tracks the stable 2.x release line. Do not use :latest.
- 127.0.0.1:3001:3001 binds the container to localhost only. The public internet must never reach port 3001 directly. The reverse proxy holds the TLS certificate and the public hostname.
- The data volume holds the database, monitor configuration and history. Keep it on local storage because Uptime Kuma's installation documentation warns that filesystems without reliable POSIX locking, including many NFS setups, can corrupt SQLite. Stop the stack before taking a filesystem-level copy.
Bring it up and verify:
sudo install -d -o "$USER" -g "$USER" /opt/uptime-kuma
cd /opt/uptime-kuma
# Paste the docker-compose.yml file above.
sudo docker compose up -d
sudo docker compose ps
Expected output of docker compose ps:
NAME          IMAGE                       STATUS                   PORTS
uptime-kuma   louislam/uptime-kuma:2      Up (healthy)             127.0.0.1:3001->3001/tcp
To reach the dashboard the first time, do not open port 3001 to the public internet, even briefly. SSH-tunnel to it:
ssh -L 3001:127.0.0.1:3001 [email protected]
Open http://localhost:3001 in your browser, create the admin account, set a strong password, close the tunnel. From now on the dashboard reaches you over HTTPS through your reverse proxy.
If you do not need manual Compose, we also offer Uptime Kuma as a one-click app. The current app page lists v1, so it does not match the v2 Compose setup in this guide. Use the manual Compose path if you specifically need v2.
Reverse Proxy and TLS
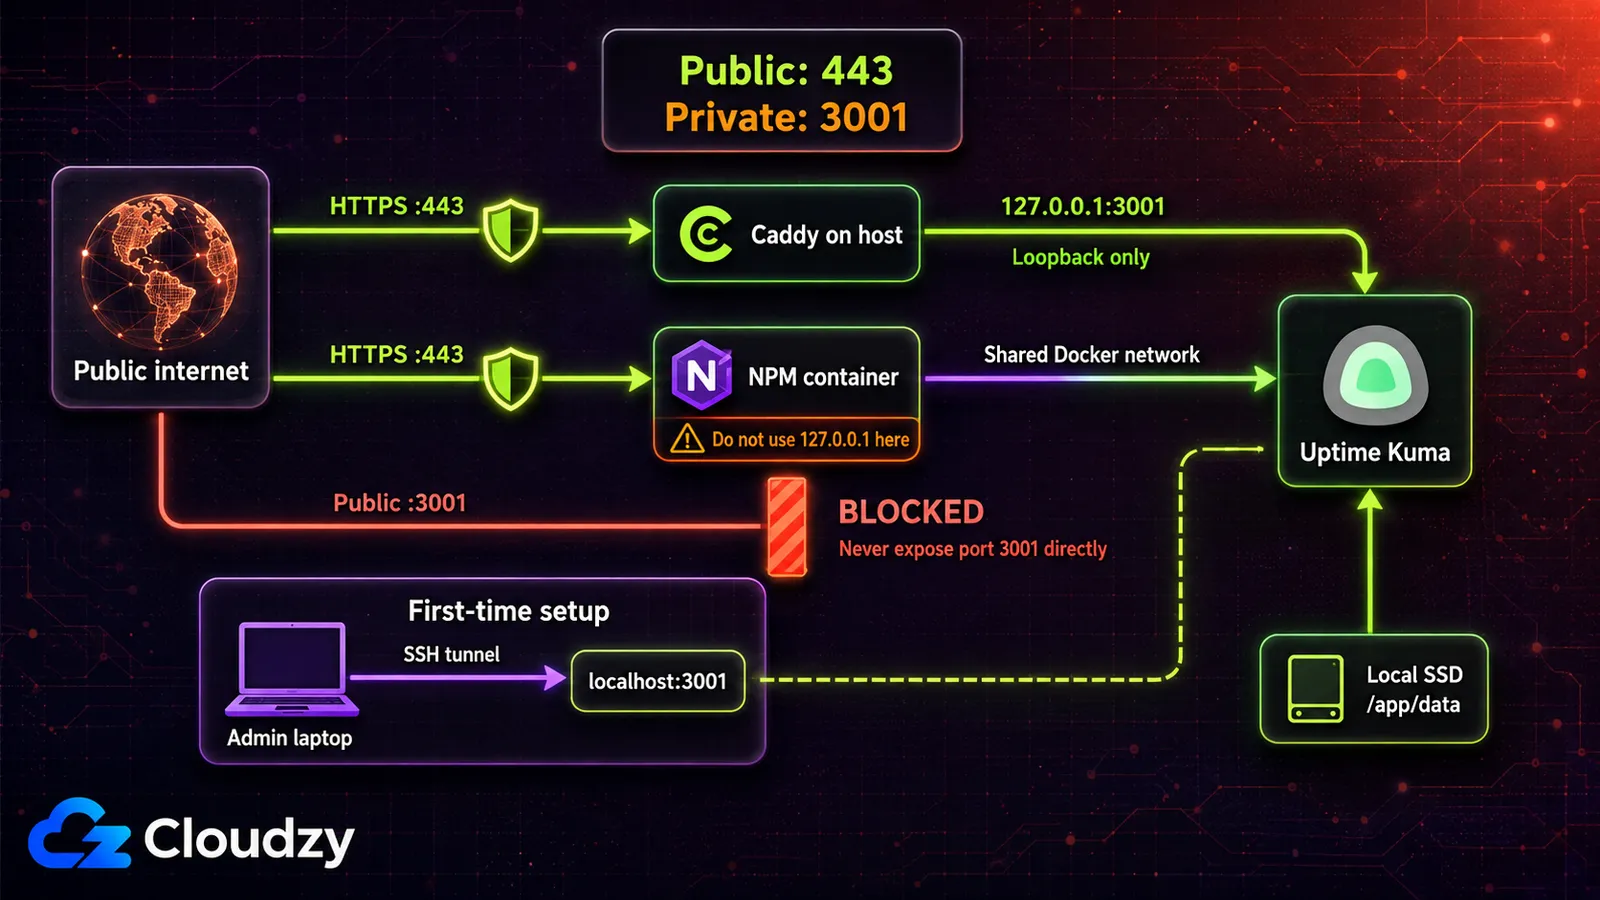
Do not expose Uptime Kuma directly. Put a reverse proxy in front of it for TLS, sane URL handling, and a single public ingress point. Two paths.
Caddy. If Caddy is not installed yet, follow its official Ubuntu package steps. With Caddy running as a host service, the Caddyfile below proxies to Uptime Kuma on loopback and handles certificate issuance and renewal automatically.
Pro Tip
When the monitoring VPS hosts only Uptime Kuma, use Caddy. The Caddyfile is three lines, and Caddy handles certificate issuance and renewal automatically. No Certbot and no separate renewal timer to babysit at 4 a.m.
Save this as /etc/caddy/Caddyfile:
status.example.com {
    reverse_proxy 127.0.0.1:3001
}
Reload Caddy:
sudo systemctl reload caddy
Verify:
curl -I https://status.example.com
You should receive a successful 2xx or 3xx response with a valid certificate. If the connection fails, confirm that the domain's A or AAAA record points to this VPS, ports 80 and 443 are reachable, and Caddy can bind to both ports. These are part of Caddy's automatic HTTPS requirements.
Nginx Proxy Manager. If NPM runs directly on the host, add a Proxy Host for status.example.com, forward it to 127.0.0.1 on port 3001, request a Let's Encrypt certificate, and enable Websockets Support. If NPM runs in Docker, 127.0.0.1 points back to the NPM container. Connect NPM and Uptime Kuma to the same Docker network instead, then forward the proxy host to uptime-kuma on port 3001.
Notification Routing: Telegram, Discord, Slack
Uptime Kuma can route the same monitor event to multiple notification channels. Configure each provider once, then attach one or more channels to a monitor based on who needs the alert.
Notifications are configured globally in Settings > Notifications, then assigned to individual monitors. Each monitor can fire to one or many channels. The same alert can hit Telegram for the on-call engineer, Slack for the team, and email for the audit log, all from one event.
Telegram
- In Telegram, message @BotFather and run /newbot. Pick a name and a username. BotFather replies with a bot token. Save it.
- Send any message to your new bot. Then visit https://api.telegram.org/bot<YOUR_TOKEN>/getUpdates in a browser. Find the chat.id field. That is your chat ID.
- In Uptime Kuma: Settings > Notifications > Setup Notification > Telegram. Paste the bot token and chat ID. Click Test. Confirm that the bot sends the synthetic alert.
- If the test message does not arrive, verify the bot token and chat ID are correct, and confirm the VPS firewall allows outbound HTTPS to api.telegram.org.
Discord
- Open the Discord server you want alerts in. Right-click the target channel, then Edit Channel > Integrations > Webhooks > New Webhook. Name it (something like "Uptime Kuma"), pick the channel, copy the webhook URL.
- In Uptime Kuma: Settings > Notifications > Setup Notification > Discord. Paste the webhook URL. Optionally set the username and avatar.
- Click Test. Confirm that the webhook posts the synthetic alert to the channel.
Slack
- In Slack, create an Incoming Webhook for the channel you want alerts in. Slack returns a webhook URL of the form https://hooks.slack.com/services/T.../B.../....
- In Uptime Kuma: Settings > Notifications > Setup Notification > Slack. Paste the webhook URL. Optionally configure the icon and channel override.
- Click Test.
Once every test passes, edit each monitor and select the notification channels it should use. Set Max Retries and Retry Interval so one brief failure does not trigger an alert immediately.
The Built-In Status Page (And When You Will Outgrow It)
Uptime Kuma includes public status pages with custom slugs, grouped monitors, custom domains, incident posts and scheduled maintenance messages. You can also publish multiple status pages from one instance for different services or audiences.
Its larger limitation is customer communication. Visitors cannot currently subscribe by email to updates directly from a status page, and the public page remains part of the same Uptime Kuma application as the operator dashboard. Visitor self-subscription is still tracked as an open feature request.
If you need customer subscriptions or a status system separated from the monitoring dashboard, Kener is one alternative. Our self-hosted monitoring stack explains how the two tools can be paired.
Common Problems
Notifications silently fail when the VPS firewall blocks outbound HTTPS. Symptom: the Test button works for some channels, not others. Fix: confirm outbound HTTPS connections are allowed and curl -I https://api.telegram.org succeeds from the VPS.
Browser shows "ERR_TOO_MANY_REDIRECTS" after enabling the proxy. Check for duplicate HTTP-to-HTTPS redirects in Caddy, Nginx Proxy Manager, or any upstream CDN. Uptime Kuma should continue serving HTTP on port 3001 while the public reverse proxy terminates TLS. If you enable trusted proxy headers, the current path is Settings > Reverse Proxy > HTTP Headers > Trust Proxy.
Container restarts every few minutes. Check whether the container was terminated for running out of memory, then watch its current usage with docker stats uptime-kuma. If the container was OOM-killed or memory stays near the VPS limit, add RAM, reduce heavy checks, or increase their intervals.
Status page works on localhost but not through the public hostname. Confirm that the reverse proxy forwards the root path unchanged, preserves the Host header, and supports WebSockets. Uptime Kuma does not support installation under a subdirectory, so use a dedicated domain or subdomain rather than a path such as example.com/uptime-kuma.
Wrap-Up
Uptime Kuma on a separate VPS gives you control over checks, alert routing, and the public status page, but you also own updates, backups, OS patching, and the monitor's external watchdog. Pick a VPS in a different location from production, deploy v2 with Docker Compose or use the one-click app after checking its listed version, put Caddy in front, and wire up the channels your team watches.
Frequently Asked Questions
How Much RAM Does Uptime Kuma Need?
Uptime Kuma does not have a dependable monitor-count-to-RAM formula because usage changes with monitor type, check interval, retry settings, history retention, and Browser Engine use. For a small set of basic checks, start with 1 GB of RAM and watch actual usage with docker stats uptime-kuma. Add memory if usage stays near the limit or the container is OOM-killed.
Should I Run Uptime Kuma on the Same Server As My App?
No. If the monitoring tool and the application share a server, a server failure takes both offline simultaneously and you lose alerting at the moment you need it most. Run Uptime Kuma on a separate VPS, ideally in a different datacenter location.
Can Uptime Kuma Send Alerts to Telegram, Discord, and Slack?
Yes. Telegram, Discord, and Slack are built-in notification services, alongside email, generic webhooks, PagerDuty, ntfy, Mattermost, and many others. Telegram uses a bot token and chat ID, while Discord and Slack use webhook URLs. You can attach multiple notification channels to the same monitor.
What Is the Difference Between Uptime Kuma and UptimeRobot?
Uptime Kuma is self-hosted, so you manage the server, updates, backups, and alert routing. It supports check intervals down to 20 seconds. UptimeRobot is hosted SaaS, and its current free plan includes 50 monitors with five-minute checks. Choose Uptime Kuma when you want control or UptimeRobot when you do not want to operate the monitoring server.
Does Uptime Kuma Have a Public Status Page?
Yes. You can choose which monitors are visible, group them, publish multiple status pages, map them to custom domains, and schedule maintenance messages. Visitor email self-subscription is not built in, so use a separate customer-facing status-page tool when customers need to subscribe to updates.

Discussion
Comments
Sign in to join the discussion.