
If you're unsure about what Prometheus and Grafana even are, read our piece on Prometheus vs Grafana comparison. If you already know the difference, here's how to run them together.
This post is the implementation companion. It deploys Prometheus, Grafana, and Node Exporter on a single VPS using Docker Compose, puts HTTPS in front of Grafana with Caddy, imports the Node Exporter Full dashboard (ID 1860), and shows you how to scrape a second VPS over WireGuard.
The original April 2026 test ran on Ubuntu 24.04 LTS with Docker Engine 27.x and Docker Compose v2.30. The version pins in the configuration below have since been refreshed to current supported releases. In that original five-host test, the hub used roughly 300 MB RAM idle and 530 to 650 MB under steady-state scraping.
TL;DR
- Hub VPS runs Prometheus, Grafana, and Node Exporter in one Compose stack, with Caddy installed on the host as a reverse proxy.
- Prometheus and Grafana bind to 127.0.0.1 only. Public access goes through Caddy with auto-HTTPS.
- Add more servers by installing Node Exporter on each one and appending entries to
prometheus.yml. - WireGuard is the recommended network path between hub and spokes. Private networking works well when your servers already share a private network.
- A 2 GB VPS was enough for the five-host test below, but treat that as a baseline rather than a fixed host-count rule.
What You'll Build
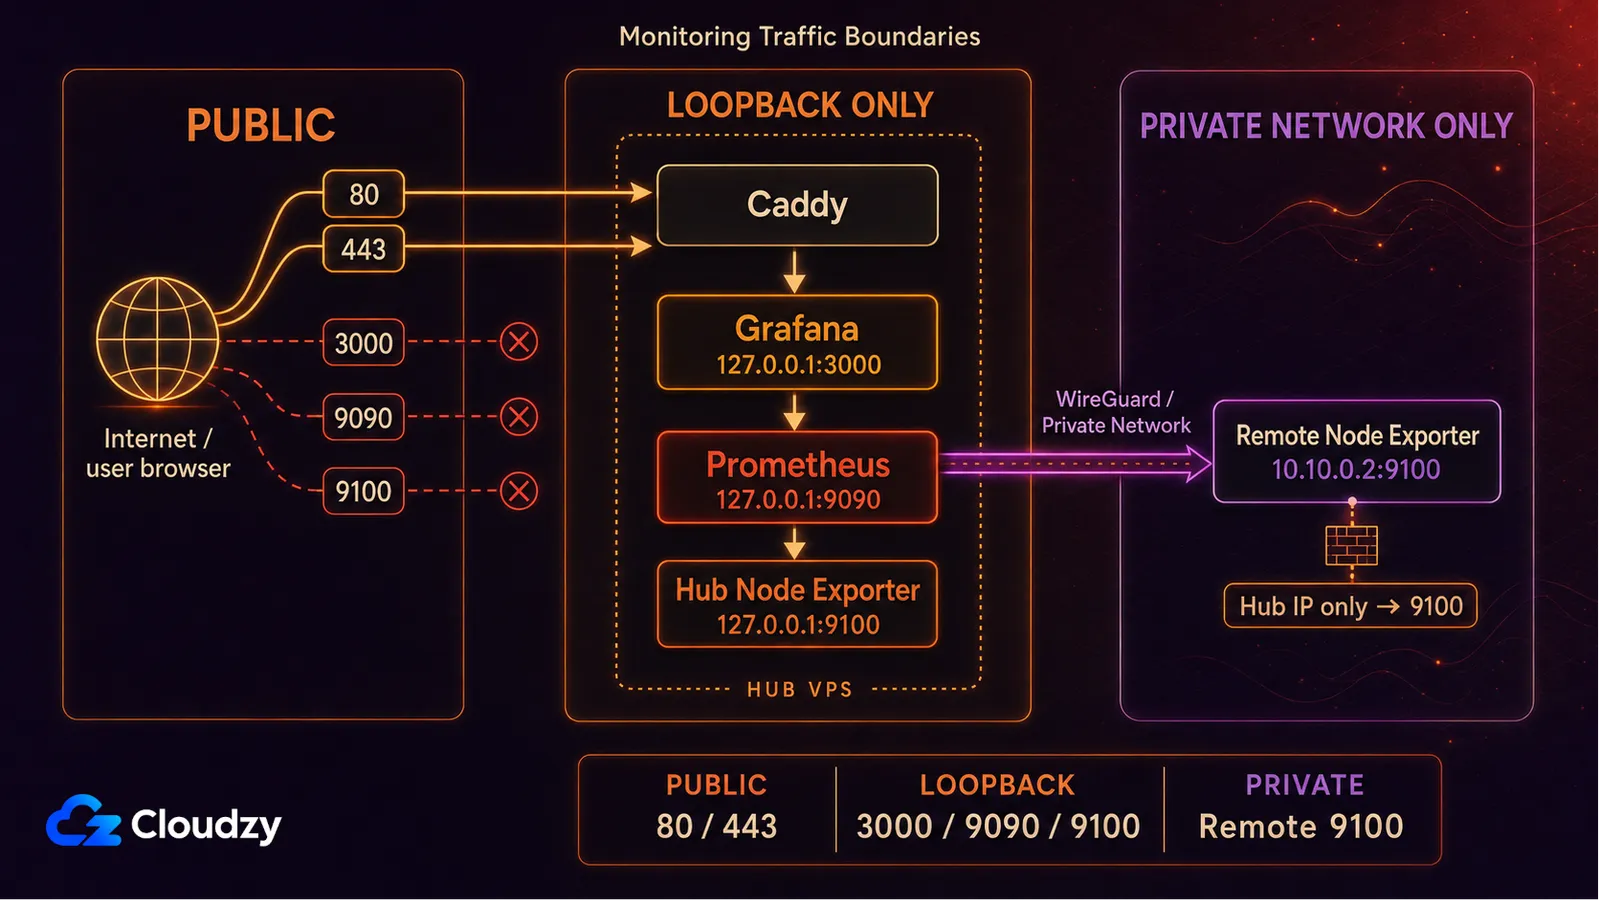
Here's a basic idea of what the setup will look like once you're done.
                 +-------------------+
                 |  Your laptop      |
                 +---------+---------+
                           | HTTPS
                           v
+--------------------------+----------------------------+
| MONITORING HUB VPS    (2 GB RAM starting point) |
|  Caddy        (reverse proxy, auto HTTPS)             |
|  Grafana      (port 3000, only via Caddy)             |
|  Prometheus   (port 9090, internal only)              |
|  Node Exporter (port 9100, scraped on localhost)      |
+----+---------------------------------+----------------+
     |                                 |
     | scrape over WireGuard           | scrape over WG
     v                                 v
+----+--------+                  +-----+-------+
|  App VPS 1  |                  |  App VPS 2  |
|  Node Expo. |                  |  Node Expo. |
+-------------+                  +-------------+
One hub VPS holds the whole monitoring stack. Every other VPS you want to monitor runs nothing but Node Exporter. Prometheus on the hub pulls metrics from each one. Grafana visualizes them. Caddy handles HTTPS.
What You Need
For this exact setup, you need one Ubuntu VPS for the hub, a domain, and sudo access.
- A VPS with at least 2 GB RAM running Ubuntu 24.04 LTS.
- A domain name with an A record pointed at the VPS public IP (for example, grafana.example.com). Required for HTTPS.
- Root or sudo access via SSH.
Throughout this guide, replace grafana.example.com with the actual subdomain you pointed at your monitoring VPS. Use the same domain in the Grafana environment variable, DNS check, and Caddyfile.
If you only want to monitor one server and you do not need HTTPS yet, you can run the Compose stack on your existing VPS without the reverse proxy section. The rest of the guide still applies.

Launch an Ubuntu VPS instantly with root access and NVMe storage.
Deploy Ubuntu VPSStep 1: Server Prep
SSH into the hub VPS as a sudo-capable user. Run a system update first.
sudo apt update && sudo apt upgrade -yInstall Docker Engine and the Compose plugin from the official Docker repository.
# Install prerequisites
sudo apt install -y ca-certificates curl gnupg lsb-release

# Add Docker's official GPG key
sudo install -m 0755 -d /etc/apt/keyrings
curl -fsSL https://download.docker.com/linux/ubuntu/gpg | \
  sudo gpg --dearmor -o /etc/apt/keyrings/docker.gpg
sudo chmod a+r /etc/apt/keyrings/docker.gpg

# Add the Docker repository
echo \
  "deb [arch=$(dpkg --print-architecture) signed-by=/etc/apt/keyrings/docker.gpg] \
  https://download.docker.com/linux/ubuntu $(lsb_release -cs) stable" | \
  sudo tee /etc/apt/sources.list.d/docker.list > /dev/null

sudo apt update
sudo apt install -y docker-ce docker-ce-cli containerd.io docker-buildx-plugin docker-compose-plugin
Verify both are installed.
docker --version
docker compose version
Both commands should return a version successfully. The exact Docker Engine and Compose versions will depend on what the official repository ships when you install them.
sudo usermod -aG docker $USERLog out and back in before continuing so the new group membership takes effect. The docker group effectively grants root-level privileges, so only add trusted administrative users.
Configure UFW to allow SSH, HTTP, and HTTPS on the monitoring hub. Port 80 handles HTTP-to-HTTPS redirects and ACME validation. Grafana itself stays behind Caddy.
sudo ufw allow OpenSSH
sudo ufw allow 80/tcp
sudo ufw allow 443/tcp
sudo ufw enable
sudo ufw status
Do not open ports 3000, 9090, or 9100 to the public internet. The monitoring services listen on 127.0.0.1 for a reason.
Step 2: The Compose Stack
Create a directory for the stack and the Prometheus config.
mkdir -p ~/monitoring/prometheus
cd ~/monitoring
Write the Compose file.
# ~/monitoring/docker-compose.yml
services:
  prometheus:
    image: prom/prometheus:v3.13.2
    container_name: prometheus
    restart: unless-stopped
    command:
      - '--config.file=/etc/prometheus/prometheus.yml'
      - '--storage.tsdb.path=/prometheus'
      - '--storage.tsdb.retention.time=15d'
      - '--web.enable-lifecycle'
      - '--web.listen-address=127.0.0.1:9090'
    volumes:
      - ./prometheus/prometheus.yml:/etc/prometheus/prometheus.yml:ro
      - prometheus_data:/prometheus
    network_mode: host
  node-exporter:
    image: prom/node-exporter:v1.12.1
    container_name: node-exporter
    restart: unless-stopped
    pid: host
    network_mode: host
    command:
      - '--path.rootfs=/host'
      - '--web.listen-address=127.0.0.1:9100'
      - '--collector.filesystem.mount-points-exclude=^/(dev|proc|sys|var/lib/docker/.+|var/lib/kubelet/.+)($$|/)'
    volumes:
      - '/:/host:ro,rslave'
  grafana:
    image: grafana/grafana:13.1.3
    container_name: grafana
    restart: unless-stopped
    environment:
      - GF_SECURITY_ADMIN_USER=admin
      - GF_SECURITY_ADMIN_PASSWORD=${GRAFANA_ADMIN_PASSWORD}
      - GF_USERS_ALLOW_SIGN_UP=false
      - GF_SERVER_ROOT_URL=https://grafana.example.com
      - GF_SERVER_HTTP_ADDR=127.0.0.1
    volumes:
      - grafana_data:/var/lib/grafana
    network_mode: host
    depends_on:
      - prometheus
volumes:
  prometheus_data:
  grafana_data:
Now write the Prometheus config.
# ~/monitoring/prometheus/prometheus.yml
global:
  scrape_interval: 15s
  evaluation_interval: 15s
  external_labels:
    monitor: 'monitoring-hub'
scrape_configs:
  - job_name: 'prometheus'
    static_configs:
      - targets: ['127.0.0.1:9090']
  - job_name: 'node'
    static_configs:
      - targets: ['127.0.0.1:9100']
        labels:
          host: 'monitoring-hub'
Create a .env file with the Grafana admin password. Use a strong password. Do not commit this file to git.
cat > ~/monitoring/.env <<'EOF'
GRAFANA_ADMIN_PASSWORD='replace-with-a-strong-password'
EOF
chmod 600 ~/monitoring/.env
A few flags above deserve a sentence each.
--web.listen-address=127.0.0.1:9090makes Prometheus listen only on the host's loopback interface. That keeps port 9090 off the public network while still letting Grafana and local administration reach it.--web.enable-lifecycleenablesPOST /-/reload, so you can apply Prometheus configuration changes without restarting the container.pid: host,network_mode: host, the host root bind mount, and--path.rootfs=/hostgive the containerized Node Exporter the host context it needs instead of monitoring only its own container environment.GF_USERS_ALLOW_SIGN_UP=falseprevents visitors from creating their own Grafana accounts. It does not make Grafana private. The login page is still publicly reachable through Caddy.
Pro Tip: If you would rather skip the manual install, Cloudzy has one-click Grafana and Prometheus deployments. The Prometheus deployment can also install Node Exporter.
Step 3: First Start and Verification
Bring the stack up.
cd ~/monitoring
docker compose up -d
Wait a few seconds, then check that all three containers are running.
docker compose psAll three services should show a running state.
Open an SSH tunnel from your laptop to verify the Prometheus targets page.
ssh -L 9090:localhost:9090 your-user@your-vps-ipThen visit http://localhost:9090/targets in your browser. You should see two targets, both with state UP:
prometheus            UP    http://127.0.0.1:9090/metrics
node                  UP    http://127.0.0.1:9100/metrics
If either is DOWN, jump to the Common Problems section. Do not continue until both are UP.
Close the tunnel when you're done checking the targets. From outside the VPS, Prometheus will remain accessible only through this SSH tunnel. The next step exposes Grafana over HTTPS.
Step 4: Reverse Proxy with HTTPS Using Caddy
Caddy is a single binary. It handles HTTPS automatically. For a single-site reverse proxy, the config is shorter than the equivalent Nginx block.
Install Caddy from the official repository.
sudo apt install -y debian-keyring debian-archive-keyring apt-transport-https curl
curl -1sLf 'https://dl.cloudsmith.io/public/caddy/stable/gpg.key' | \
  sudo gpg --dearmor -o /usr/share/keyrings/caddy-stable-archive-keyring.gpg
curl -1sLf 'https://dl.cloudsmith.io/public/caddy/stable/debian.deb.txt' | \
  sudo tee /etc/apt/sources.list.d/caddy-stable.list
sudo chmod o+r /usr/share/keyrings/caddy-stable-archive-keyring.gpg
sudo chmod o+r /etc/apt/sources.list.d/caddy-stable.list
sudo apt update
sudo apt install -y caddy
Before the next step, confirm your DNS A record for grafana.example.com points to the VPS public IP. Without that, ACME validation fails.
dig +short grafana.example.com
# Should print the VPS public IP
Edit the Caddyfile.
# /etc/caddy/Caddyfile
grafana.example.com {
    reverse_proxy 127.0.0.1:3000
    encode gzip
}
Reload Caddy.
sudo systemctl reload caddyCaddy automatically obtains and renews publicly trusted TLS certificates through ACME once the domain points to your server and ports 80 and 443 are reachable. Visit https://grafana.example.com in your browser. You should see the Grafana login page on a valid HTTPS connection. Log in with admin and the password from your .env file.
Step 5: Add Prometheus as a Data Source and Import Dashboard 1860
In the Grafana UI, go to Connections > Data sources > Add data source and pick Prometheus.
Set the URL to:
http://127.0.0.1:9090Grafana and Prometheus share the host network in this setup, while Prometheus listens only on loopback. Click Save & test and confirm Grafana can query the Prometheus API. You should see "Successfully queried the Prometheus API".
Now import the dashboard. Node Exporter Full (ID 1860 by rfmoz) is a widely used community dashboard for Node Exporter metrics. It covers CPU, memory, disk I/O, network, file descriptors, and hardware temperatures where the host exposes them. It also has variables for job and instance, so it works for hub-and-spoke without modification.
Go to Dashboards > New > Import dashboard, enter dashboard ID 1860, select your Prometheus data source, and import it.
The dashboard should populate once your Node Exporter target is UP. Dashboard 1860 also uses metrics from the optional systemd and processes collectors for some panels, so an individual empty panel doesn't necessarily mean the target is broken.
Step 6: Add a Second VPS (Hub-and-Spoke)
Before starting Node Exporter, make sure the private IP you plan to bind to already exists on the second VPS. If you're using WireGuard, finish the WireGuard setup first.
On the second VPS, install Docker using the Docker-install portion of Step 1, but don't open ports 80 or 443 just for monitoring. Then run Node Exporter alone.
mkdir -p ~/node-exporter
cd ~/node-exporter

cat > docker-compose.yml <<'EOF'
services:
  node-exporter:
    image: prom/node-exporter:v1.12.1
    container_name: node-exporter
    restart: unless-stopped
    pid: host
    command:
      - '--path.rootfs=/host'
      - '--web.listen-address=10.10.0.2:9100'  # bind to the private monitoring IP, never 0.0.0.0
    volumes:
      - '/:/host:ro,rslave'
    network_mode: host
EOF

docker compose up -d
Replace 10.10.0.2 with this server's private monitoring IP. If you're using WireGuard, use its WireGuard IP. If you're using Cloudzy private networking, use the VPS's private-interface IP. If UFW is already active on this VPS, allow only the monitoring hub to reach Node Exporter. For example, if the hub's private IP is 10.10.0.1:
sudo ufw allow proto tcp from 10.10.0.1 to any port 9100
sudo ufw status
Replace 10.10.0.1 with the hub's actual private IP. If UFW is inactive, the explicit --web.listen-address still keeps Node Exporter off the public interface, but other machines that can reach that private network may also reach port 9100.
Two good options for the network path between hub and spokes:
- WireGuard network. Every VPS joins a WireGuard network. Prometheus scrapes private IPs. The most secure option after the initial WireGuard setup. We offer WireGuard as a one-click deploy and also have an existing setup tutorial on it.
- Cloudzy private networking. Cloudzy VPS instances in the same region get a private interface for east-west traffic, so you can scrape that address instead of building a separate WireGuard tunnel.

Once Node Exporter is running on the second VPS and reachable on its private IP, replace the existing node job in prometheus.yml on the hub with the block below.
# Update the existing 'node' job in ~/monitoring/prometheus/prometheus.yml
  - job_name: 'node'
    static_configs:
      - targets: ['127.0.0.1:9100']
        labels:
          host: 'monitoring-hub'
      - targets: ['10.10.0.2:9100']
        labels:
          host: 'app-vps-1'
          tier: 'production'
Reload Prometheus without restarting the container.
curl -X POST http://localhost:9090/-/reloadReopen the SSH tunnel from Step 3, then visit http://localhost:9090/targets. The new target should appear as UP. Open the Node Exporter Full dashboard, change the instance variable at the top to the new server, and you should see its graphs.
Resource Usage and When to Upgrade
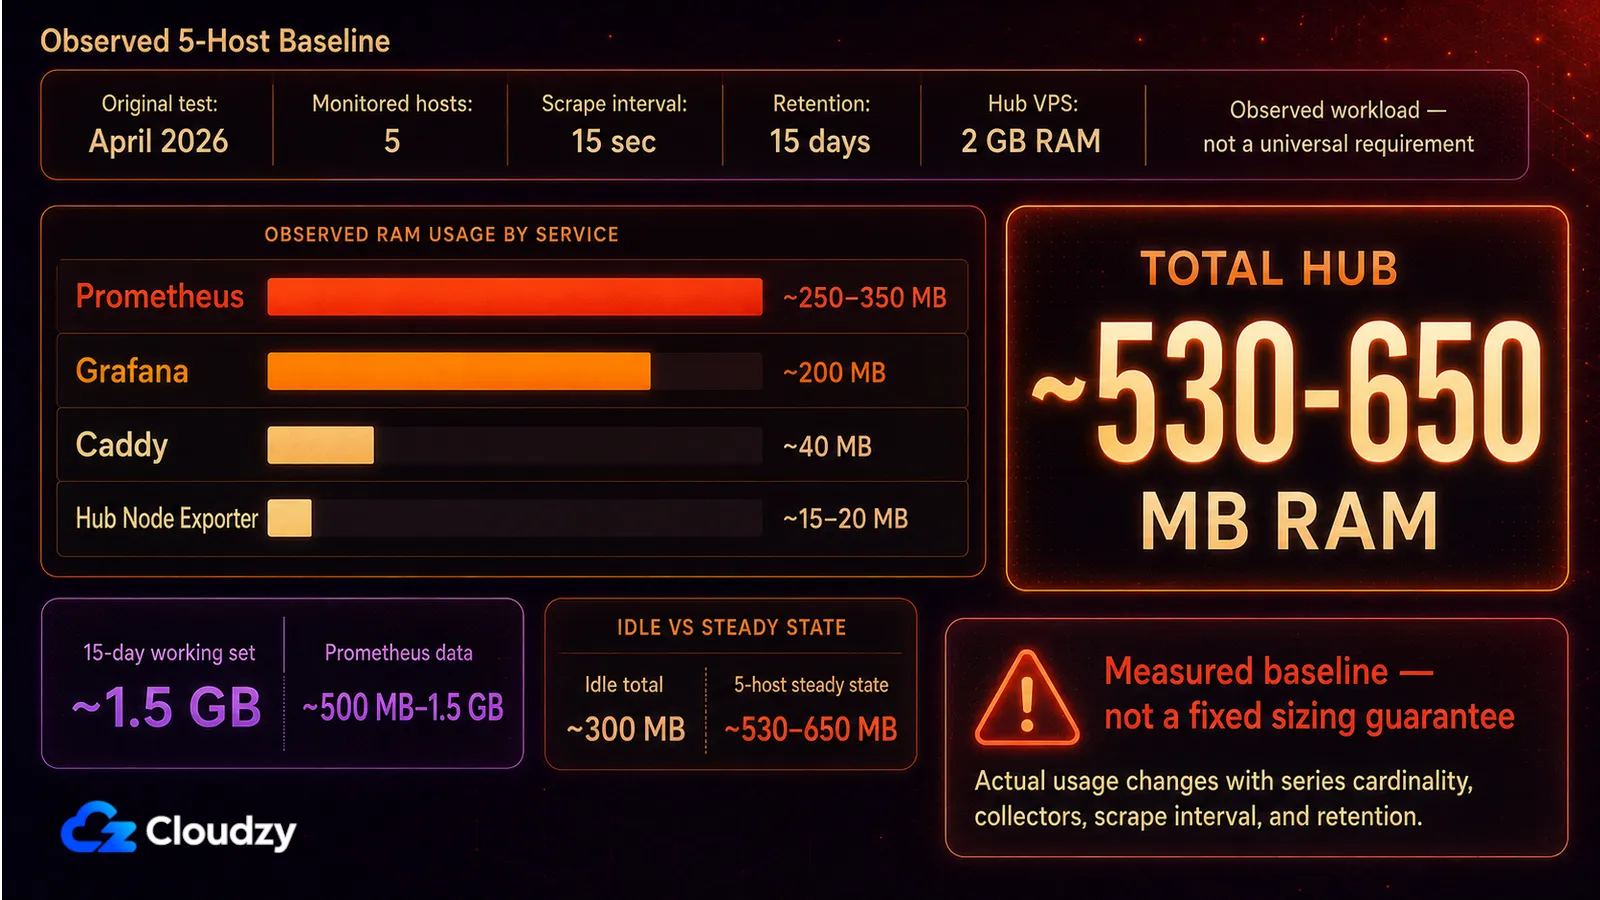
These numbers come from the original April 2026 test on a 2 GB Ubuntu VPS with five monitored hosts. Treat them as a baseline for this workload rather than a fixed sizing guarantee for newer releases.
| Component | Idle RAM | Active RAM (1 host) | RAM with 5 hosts | Disk (15d retention, 5 hosts) |
|---|---|---|---|---|
| Prometheus | ~100 MB | ~150 MB | ~250-350 MB | ~500 MB to 1.5 GB |
| Grafana | ~150 MB | ~180 MB | ~200 MB | ~50 MB |
| Node Exporter | ~15 MB | ~20 MB | not applicable | negligible |
| Caddy | ~30 MB | ~40 MB | ~40 MB | not applicable |
| Total hub | ~300 MB | ~390 MB | ~530-650 MB | ~1.5 GB working set |
Upgrade when the hub starts running short on memory or disk headroom. Host count alone is a poor sizing trigger because series cardinality, enabled collectors, scrape interval, and retention all change the footprint. For longer-term centralized storage, Prometheus supports remote-storage integrations. VictoriaMetrics is one Prometheus-compatible option.
Common Problems
The seven issues that show up most often, with fixes.
- Prometheus reachable from the public internet. A bare 9090:9090 port mapping exposes Prometheus to the world. Fix: keep
--web.listen-address=127.0.0.1:9090in the Prometheus command as shown above. That makes Prometheus listen only on the host's loopback interface. - Grafana data source can't reach Prometheus. This stack uses host networking, so Grafana can reach Prometheus at http://127.0.0.1:9090. Check that Prometheus is running and still listening on loopback.
- Node Exporter dashboard shows "No data". Three usual causes. (a) Prometheus is not scraping the target. Check
/targets. (b) The job label in the dashboard variable does not match thejob_namein scrape config. (c) A firewall blocks port 9100 between hub and target. - Grafana admin password is
admin/adminin production. SetGF_SECURITY_ADMIN_PASSWORDfrom a .env file before the first start. If you missed it, change it on first login and disable sign-up. - Caddy "ACME challenge failed". DNS A record has not propagated yet, or port 80 is blocked. Run
ufw allow 80,443/tcp, wait for DNS, runsudo systemctl reload caddy. Usedig +shortto confirm propagation. - Prometheus disk fills up. High-cardinality labels or short scrape intervals on many hosts can fill the volume fast. Watch
prometheus_tsdb_head_seriesand the volume size. Mitigations: drop unused Node Exporter collectors, lengthenscrape_intervalto 30s, or shorten retention. - Bind mount permission errors. If you mount a host directory instead of a named volume, the container UID (65534 for Prometheus, 472 for Grafana) needs write access. Named volumes, as in the Compose file above, avoid this.
When This Stack Is Overkill
If all you want is an alert when a URL stops responding, this stack is overkill. Uptime Kuma is a much lighter fit if basic uptime checks are all you need.
Frequently Asked Questions
What Is the Difference Between Prometheus and Grafana?
Prometheus is a time-series database that scrapes metrics from configured targets at intervals you set, stores them on disk, and answers PromQL queries. Grafana is a visualization layer that connects to Prometheus (and many other data sources) and renders dashboards. You almost always want both: Prometheus to collect and store, Grafana to display.
How Much RAM Does a Prometheus + Grafana Setup Need?
A monitoring hub running Prometheus, Grafana, Node Exporter, and a reverse proxy on a single VPS uses roughly 300 MB of RAM idle and 530 to 650 MB when actively scraping five hosts at a 15-second interval.
Can I Monitor Multiple Servers With One Grafana Instance?
Yes. The standard pattern is hub-and-spoke. One Prometheus instance on a hub VPS scrapes Node Exporter running on every other server you want to monitor. Grafana on the hub queries that single Prometheus. The Node Exporter Full dashboard (ID 1860) supports an instance variable so you can switch between servers from one dashboard.
Which Is the Best Grafana Dashboard for Node Exporter?
For this setup, Node Exporter Full (dashboard ID 1860 by rfmoz) is a strong default. It covers the main Node Exporter host metrics and supports job and instance variables for multi-server monitoring. Some panels depend on optional Node Exporter collectors, so an empty individual panel does not necessarily mean the scrape target is broken.
How Do I Expose Grafana Over HTTPS?
Run Grafana bound to 127.0.0.1:3000 and put a reverse proxy in front of it that handles HTTPS. Caddy is the simplest option: a four-line Caddyfile with reverse_proxy 127.0.0.1:3000 and a domain block does the whole thing including automatic TLS certificate management.
Is Prometheus + Grafana Free for Commercial Use?
Prometheus is licensed under Apache 2.0. Grafana OSS is AGPLv3. Internal and commercial use of unmodified Grafana OSS is allowed, but modifying or distributing it, or offering a modified version over a network, can create source-sharing obligations under the AGPL. Grafana Enterprise and Grafana Cloud use separate commercial terms.
When Should I Switch From Prometheus to VictoriaMetrics?
Consider VictoriaMetrics when longer retention, high series cardinality, or multiple Prometheus instances make the local Prometheus TSDB harder to operate within your server's memory and disk budget. VictoriaMetrics can receive Prometheus data and expose a Prometheus-compatible query API, so it can work as long-term storage or as the Grafana metrics backend. Benchmark it against your own workload instead of switching at a fixed RAM threshold.


Discussion
Comments
Sign in to join the discussion.