
Andrej Karpathy, a co-founder of OpenAI, spent a Saturday morning in March 2026 on a small side project: he had an LLM score how "digitally exposed" a few hundred U.S. occupations are, on a 0-to-10 scale. Software developers landed at 9 out of 10. The story spread fast, and by the next morning Karpathy had taken it down (it has since been restored with added disclaimers). He said it had been "wildly misinterpreted," even though the project notes explicitly warned that a high score did not mean a job would disappear.
How AI job risk scores are calculated matters more than the headline number itself. Karpathy's project, Goldman Sachs, the International Monetary Fund (IMF), and Anthropic all use different constructions for "exposure," so their percentages are not interchangeable.
The same occupation can land at very different scores depending on the method behind it, and none of these measures, on its own, tells you whether you're going to lose your job.
TL;DR
- Public "AI job risk" numbers are not one metric. Many start with theoretical exposure based on job abilities or tasks, while Anthropic also measures observed AI use; employer surveys such as the World Economic Forum's use a different instrument again.
- Theoretical and observed-use measures can disagree sharply for the same occupation. In Anthropic's March 2026 comparison, the Eloundou et al. theoretical measure put Computer and Math tasks at 94% exposure, while Anthropic's observed-exposure measure reached 33%.
- A 2025 peer-reviewed PNAS Nexus study compared twelve exposure scores with unemployment risk and found that the best individual score explained 10.7% of the variation on its own; combining all twelve raised that to 29.8%.
- Before trusting the next "AI job risk" number you see, the useful question is which method produced it, not just what the number says.
What This Article Doesn't Cover
This is a mechanism explainer, not a verdict on any specific job, so a few adjacent questions stay outside its scope:
- It doesn't rank which occupations are safest or most at risk. That's a different kind of piece.
- It doesn't analyze current hiring trends by age or seniority; those labor-market outcomes need a separate evidence base from exposure scores.
- It doesn't forecast where AI capability goes next. The methodology question stands regardless of how good future models get.
How Theoretical Exposure Scoring Works: O*NET, AIOE, Goldman Sachs, and the IMF
The AI Occupational Exposure index, known as AIOE, cross-references ten AI application categories with 52 occupational abilities in O*NET. A crowd-sourced matrix rates how related each AI application is to each human ability, and the score is then weighted by how prevalent and important those abilities are in a given occupation. Economists Edward Felten, Manav Raj, and Robert Seamans published the method in the Strategic Management Journal in 2021. It became one influential foundation for later attempts to measure occupational AI exposure.
The important thing about AIOE is that it's an exposure measure, not an adoption measure. It estimates how strongly advances in AI applications overlap with the abilities an occupation requires; it does not tell you whether employers are using AI there, whether adoption is economically worthwhile, or whether employment will fall.
The IMF adapted the Felten, Raj, and Seamans exposure measure in a January 2024 staff discussion note and paired it with a separate complementarity index that captures how much an occupation is shielded from outright substitution by factors such as human judgment, social context, and physical presence. Using that framework, the IMF estimated that almost 40% of global employment is in high-exposure occupations, rising to about 60% in advanced economies.
Goldman Sachs' April 2026 analysis takes a similar next step: it combines a previous AI displacement score with the IMF economists' complementarity index to separate likely substitution from augmentation. Goldman estimates a net drag of roughly 16,000 jobs a month on U.S. payroll growth over the previous year, while occupations with AI-augmentation potential added about 9,000 jobs a month.
Note
The World Economic Forum's Future of Jobs Report projects 92 million jobs displaced and 170 million created by 2030, but it isn't built the same way at all. It comes from a survey of more than 1,000 employers reporting the headcount changes they expect: an employer self-report, not task-decomposition scoring. Two structurally different instruments end up quoted in the same "X million jobs" sentence.
How Anthropic Measures "Observed Exposure" Differently
Anthropic's Economic Index, first published in February 2025, starts from a completely different kind of data: about one million real Claude.ai conversations, run through an internal tool called Clio that maps each conversation to a specific task in the same O*NET database the task-decomposition scores draw on, without a researcher reading the underlying chat. Where AIOE asks whether AI could plausibly do a task, the Index asks what people are asking it to do. That first report split conversations 57.4% augmentation, meaning Claude assists while a person still directs the work, against 42.6% automation, meaning Claude effectively does the task end to end.
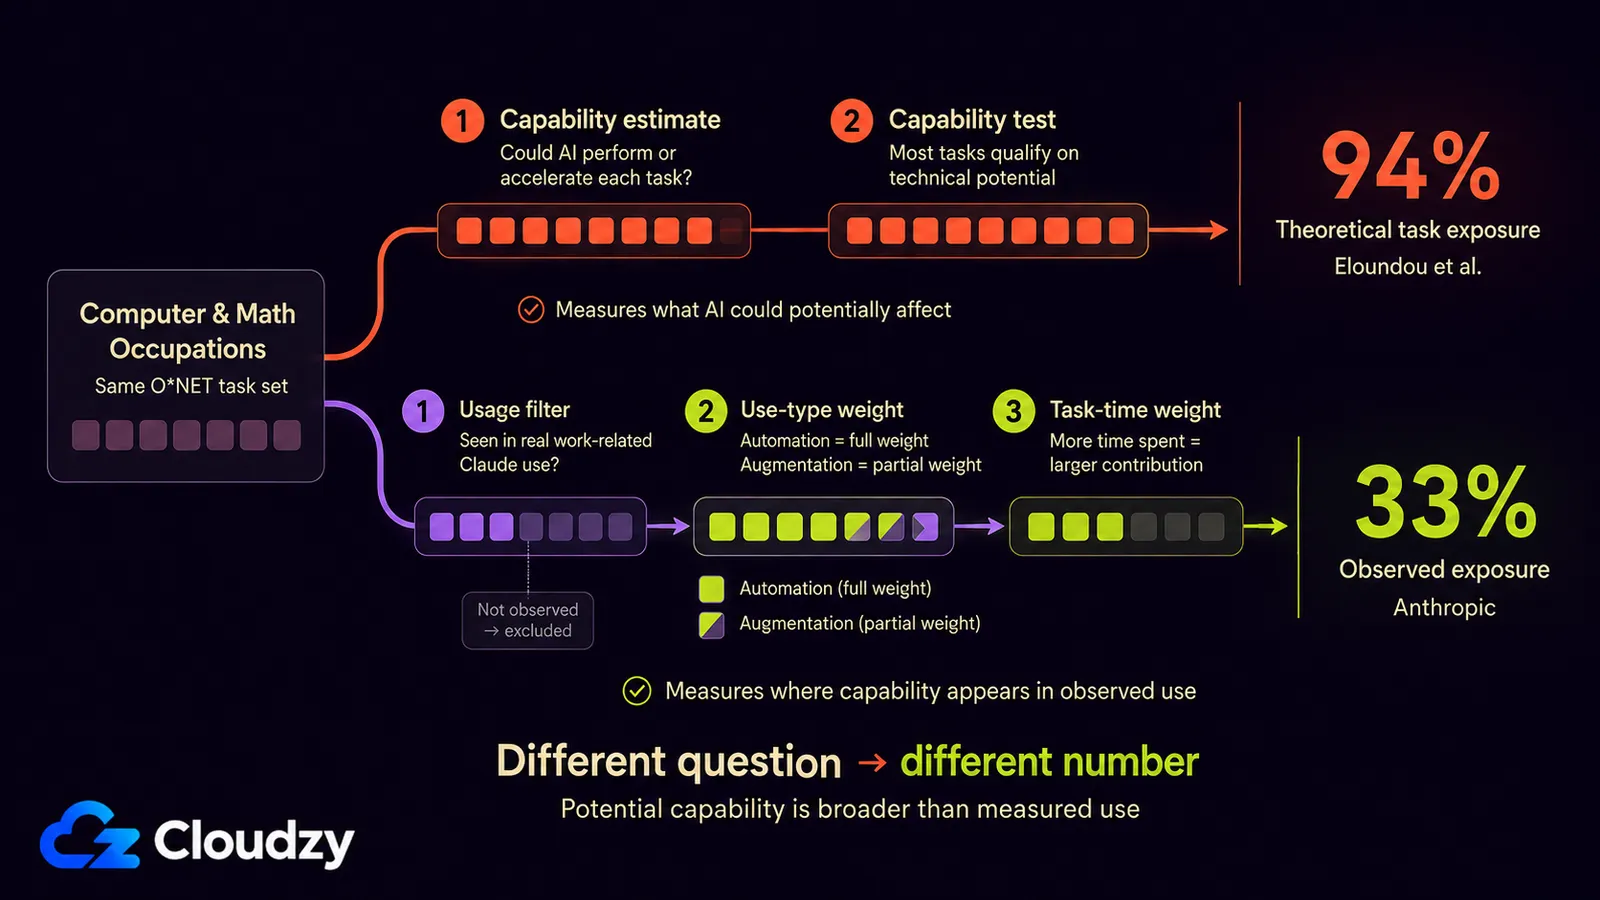
In its March 2026 follow-up, Anthropic turned that usage data into a new "observed exposure" measure. It starts with O*NET tasks and theoretical task-exposure estimates from Eloundou et al. (2023), then counts a task as covered only when it appears often enough in work-related Claude usage. Fully automated uses receive full weight, augmentative uses half weight, and task coverage is weighted by the share of time workers spend on each task. In Computer and Math occupations, Eloundou et al.'s theoretical β measure reaches 94% of tasks, while Anthropic's observed-exposure measure reaches 33%. The gap is not a contradiction: one measures technical feasibility, while the other adds observed adoption and use.
Not everyone reading Anthropic's own reports has taken the comparison at face value. Reacting to a related January 2026 report, a Hacker News commenter wrote: "I expected to see measures of the economic productivity generated as a result of artificial intelligence use. Instead, what I'm seeing is measures of artificial intelligence use." It's a fair distinction to hold onto: usage volume and economic productivity are not the same thing, and neither one is the same thing as job loss.
That January 2026 report, Anthropic's own economic primitives update, shows the augmentation-automation split had moved again: augmentation ahead at 52% of conversations against 45% automation, alongside a newer five-part framework tracking task complexity, skills, use case, AI autonomy, and task success. Treat this as a new snapshot of an evolving index, not a contradiction of the February 2025 numbers. Usage patterns shift as people find new things worth delegating.
A 94% theoretical-exposure figure and a 33% observed-exposure figure can describe the same occupational category without contradicting each other, because they measure different things.
Why "Exposure" Isn't the Same as "Job Loss"
"Exposure indicators reveal technological susceptibility, not labour market outcomes."
International Labour Organization, April 2026
A theoretical exposure score and an observed-exposure score both capture something real about a job's relationship to AI capability. Neither one tells you whether that job still exists next year.
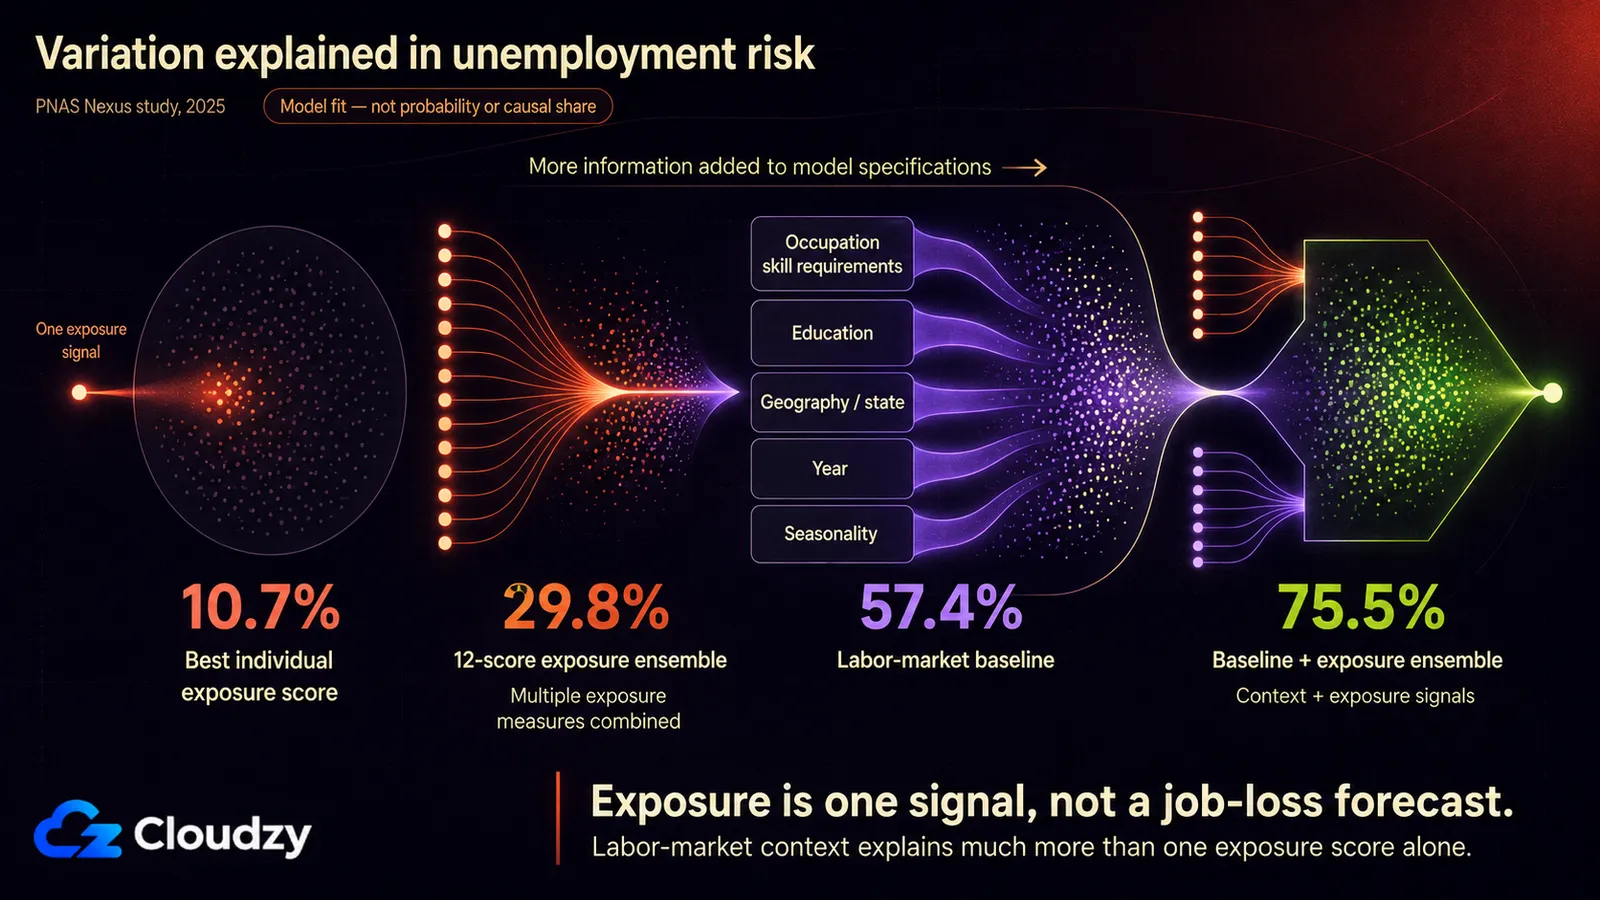
In 2025, Morgan Frank, Yong-Yeol Ahn, and Esteban Moro tested that gap against U.S. unemployment data. They compared twelve published exposure scores with monthly occupation-by-state unemployment risk built from state unemployment-insurance records. The best individual score explained 10.7% of the variation in unemployment risk across occupations, states, and months; the ensemble of twelve scores explained 29.8%. A baseline model using occupation skill requirements, education, state, year, and seasonality explained 57.4%, and adding the exposure-score ensemble raised that to 75.5%.
Read plainly, a single exposure score is a weak standalone predictor of unemployment risk. Much more of the variation is associated with labor-market structure the score does not contain, including occupational skill requirements, education, geography, and seasonality.
| Dimension | Theoretical / Task-Based Exposure | Observed Exposure (Anthropic) |
|---|---|---|
| What it measures | How much of a job AI could potentially affect or accelerate | Which theoretically feasible tasks appear in work-related Claude use |
| Who uses it | Used in several academic and institutional exposure frameworks | Anthropic, for its own Claude.ai usage |
| Data source | O*NET job components plus method-specific AI capability ratings | Claude usage plus O*NET tasks and theoretical feasibility |
| What it captures well | Where AI capability could potentially affect work | Observed adoption and how work is delegated to Claude |
| What it misses | Demand, cost, regulation, whether anyone bothers | Non-Claude usage; reflects one product's users |
| Example figure | Computer & Math: 94% theoretical (Eloundou et al.) | Computer & Math: 33% observed |
OpenAI's April 2026 AI Jobs Transition Framework makes the same point from a different angle. Instead of treating technical exposure as a displacement forecast, it asks three questions: can AI perform a meaningful share of an occupation's tasks, does a person remain central to delivering or supervising the work, and could lower costs increase demand enough to absorb the productivity gain? Applied across 921 occupations covering roughly 148 million U.S. jobs, the framework places about 18% of jobs in the higher automation-risk category, 24% in jobs likely to reorganize, 12% in jobs that could grow with AI, and 46% in jobs expected to see less immediate change.
In the PNAS Nexus study, the strongest individual exposure score explained 10.7% of the variation in unemployment risk on its own.
So when the next "AI job risk" number crosses your feed, the useful move is figuring out which of these methods produced it before deciding whether to worry. A theoretical exposure score tells you where AI capability overlaps with the components of a job. An observed-exposure score adds evidence about where people are already using AI in practice. Neither one, alone, tells you whether employment in that occupation will rise or fall; that requires labor-market evidence on hiring, demand, wages, and headcount.
Frequently Asked Questions
Is AI Job Exposure the Same as Job Loss?
No. Theoretical exposure describes where AI capability overlaps with a job's work, while observed exposure adds evidence about where AI is being used in practice. Neither is a direct measure of job loss. A 2025 peer-reviewed study tested this directly by checking twelve exposure scores against real U.S. unemployment-insurance claims data: the best-performing individual score explained 10.7% of the variation in unemployment risk on its own.
How Is AI Job Risk Actually Calculated?
Several methods sit behind numbers labeled "AI job risk." Theoretical exposure methods break occupations into O*NET abilities or tasks and score how strongly AI capabilities overlap with them; the exact scoring method differs by study. Anthropic's observed-exposure approach combines theoretical task feasibility with real Claude usage, work context, and the degree of automation. The resulting numbers differ because they measure different stages between technical possibility and real-world adoption.
Why Do Different AI Job Risk Rankings Disagree About the Same Job?
Partly because they're built on structurally different methods (task-decomposition, employer survey, and observed usage all answer different questions), and partly because even one method shifts over time. Anthropic's own Economic Index put augmentation at 57.4% of Claude conversations in February 2025 and at 52% in its January 2026 report, with automation moving accordingly. A snapshot from one date isn't a fixed law.
Does a High AI Exposure Score Mean My Job Is Disappearing?
Not by itself. Andrej Karpathy, who took down his own viral AI-exposure project in March 2026, wrote directly into its own README that the scores are "rough LLM estimates... not rigorous predictions" and that high-exposure jobs will more often be "reshaped, not replaced." Anthropic's comparison makes the distinction visible: in Computer and Math, the Eloundou et al. theoretical measure reaches 94%, while Anthropic's observed-exposure measure reaches 33%. A high number on a capability scale is not the same as a job being taken over.



Discussion
Comments
Sign in to join the discussion.