GPU monitoring software is the thing that can change “my GPU feels off” into a direct and clear explanation, like “hotspot spiked, clocks dropped, and VRAM filled up.”
In this guide, I’ll walk you through the tools you can use for AI jobs, gaming overlays, and long workstation sessions, and show the GPU metrics that help you diagnose slowdowns, stutters, and crashes.
By the end, you’ll have a GPU monitoring software setup that should fit how you work. You’ll also get copyable stacks for four common use cases, so you won’t have to look up articles again.
Quick Answer: Top GPU Monitoring Software Picks by Use Case
If you just want a short list that matches how people actually work, start with these. In practice, the best GPU monitoring software stack is usually a combo: one thing for quick checks, one thing for overlays or logs, and one thing for history or alerts.
Here’s the fast map:
| Use Case | Best Starting Stack | What You Get |
| AI training, inference, HPC jobs | nvidia-smi (NVIDIA) or AMD SMI (AMD) + logging/exporter | Fast checks, scriptable logs, easy alerting |
| Gaming on Windows | MSI Afterburner + RTSS + a frametime capture tool | Overlay plus proof for stutter vs low FPS |
| Gaming on Linux | MangoHud + a terminal checker (nvtop) | Lightweight overlay plus per-process sanity checks |
| Workstations (3D/video/CAD) | HWiNFO logging + a simple stress test | Long logs you can share, repeatable repro |
| Shared GPU machines | nvtop (Linux) + exporter/dashboard | Per-process VRAM visibility |
From here, the main job is matching GPU monitoring software to the way you consume data: on-screen, in a log, or in a dashboard.
Who This Guide Is for
I’m going to write this like someone who’s had to debug real machines. That’s because, from experience, I know different readers need different GPU tools, even if they’re staring at the same GPU.
Here are the four setups I’m targeting:
- The Model Builder (AI/ML): cares about VRAM headroom, sustained clocks, throttling, and “did the job run all night without dying?”
- The Competitive Gamer/Streamer: cares about frametimes, overlay stability, and spotting regressions after driver updates.
- The Workstation User (3D/video/CAD): cares about logs, reproducible crashes, and pinpointing heat vs power vs driver behavior.
- The Admin Running GPU Machines: cares about alerts, trend graphs, capacity planning, and catching failures early.
Once you know which bucket you’re in, you can easily pick the GPU monitoring software that suits you.
How to Pick GPU Monitoring Software
A lot of performance monitoring apps look similar until you try to use them for a week. The main difference is usually in output and reliability, instead of those attractive “features” that each one desperately advertises.
I present you with three questions to help you pick GPU monitoring software quickly:
- Do you need an overlay, a log, or both?
Gamers want an overlay. AI and workstation work usually needs logging. Admins want logs plus alerts. - Do you need per-process visibility?
If you share a box (lab, studio, remote server), per-process VRAM is often the first thing you look for. - Do you need history and alerts?
If jobs run overnight, “I’ll check it later” is not enough. You want a graph and an alert.
To keep this practical, the rest of the guide is organized by GPU metrics first, then tool stacks that fit each use-case.
GPU Metrics You Should Prioritize
Good GPU monitoring software gives you a lot of numbers. Genuinely useful GPU monitoring software gives you that specific handful that explains behavior. I group GPU metrics by the decision they help you make.
Thermals and Throttling Metrics
These are the GPU metrics that explain “it was fast for 10 minutes, then it wasn’t”:
- GPU temperature
- Hotspot temperature (often the first thing to spike)
- Memory temperature/junction (more relevant on long AI runs and long renders)
- Fan speed (helps spot laptop profiles or bad fan curves)
If you’re looking to improve stability, log these, as single snapshots rarely give enough info.
Power, Clocks, and Limits
These GPU metrics explain downclocking and inconsistent performance:
- Board power draw
- Core clock and memory clock
- Power limit/performance state (if your tool exposes it)
In a lot of real-world debugging, power and clocks paint a much clearer picture than basic “GPU usage %”.
VRAM and Memory Pressure
These GPU metrics explain stutter, OOM errors, and the typical “random” slowdowns:
- VRAM used vs total
- Memory controller activity (helps spot bandwidth limits)
- System RAM pressure (because VRAM spill can drag the system down too)
For AI, VRAM is often the hard ceiling. For games, VRAM pressure often shows up as frametime spikes first.
Frametime and Frame Pacing Metrics
For gaming and streaming, FPS alone can be misleading. Frametime is the metric you want to pay attention to, as that tracks the smoothness or lack thereof:
- Frametime (ms)
- 1% low / 0.1% low (good for comparisons)
- GPU busy vs CPU busy (helps separate GPU bottlenecks from CPU bottlenecks)
This is why gaming-focused performance monitoring apps often include a frametime capture path. With the metric basics out of the way, we can talk about the best GPU monitoring software stacks for each workflow.
GPU Monitoring Software for AI, Training, and Servers
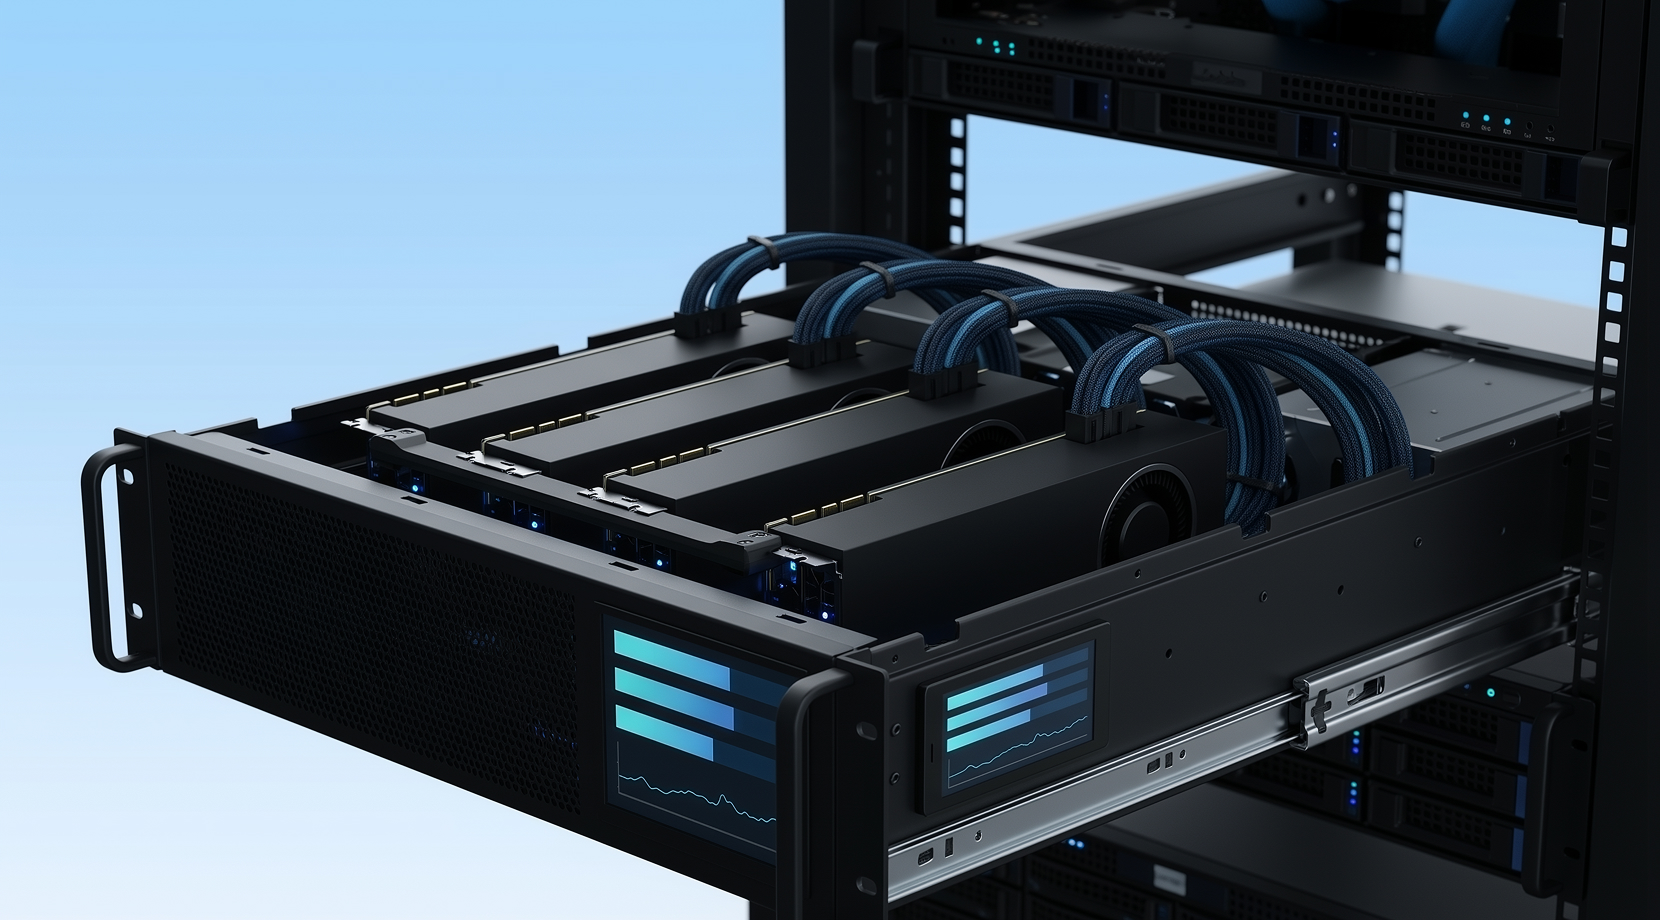
AI monitoring has a simple setup with quick checks in a terminal, plus logs and alerts for long runs. For this, GPU monitoring software that speaks CLI and exports metrics is the thing you want.
NVIDIA: nvidia-smi for Quick Checks and Scriptable Logs
On NVIDIA systems, nvidia-smi is usually the first command people run because it ships with the driver and is designed for monitoring and management via NVML.
Official docs are here: NVIDIA System Management Interface (nvidia-smi).
If you want a simple “log it and look later” approach (and you’d be surprised how often this solves the issue), this pattern is pretty reliable:
nvidia-smi –query-gpu=timestamp,name,utilization.gpu,utilization.memory,memory.used,memory.total,temperature.gpu,power.draw,clocks.sm \
–format=csv,noheader,nounits -l 5 >> gpu_log.csv
This is basic GPU monitoring software behavior with timestamps, core GPU metrics, and an output that works well with scripts.
AMD: AMD SMI for ROCm and HPC Nodes
On AMD Linux compute nodes, AMD SMI is the modern monitoring and management interface, and AMD documents it as a unified toolset for monitoring and control in HPC contexts.
Official docs are here: AMD SMI Documentation.
If your environment is AMD-heavy, AMD SMI is the GPU monitoring software foundation that other tooling tends to build on.
Per-Process Visibility: nvtop for Shared GPUs
If you’ve ever had a shared box where VRAM “mysteriously” stays full, per-process visibility saves time. On Linux, nvtop is popular for exactly that reason, since it makes “who is using VRAM?” obvious. On AMD/Intel, you may need a recent kernel for per-process stats.
In mixed teams, I often see people run nvtop side-by-side with nvidia-smi or AMD SMI. It’s a simple pairing that avoids a lot of guesswork, so I strongly recommend it.
Don’t Overlook Hardware Choice!
Monitoring doesn’t fix a VRAM ceiling; it just makes the ceiling visible. If you’re still mapping workloads to GPU tiers, our guide on Best GPUs for Machine Learning in 2025 is a helpful companion because it frames VRAM and bandwidth the same way you’ll read them later in logs and dashboards.
Once you’ve got server-style GPU monitoring software under control, the next step is overlays and frametimes, since interactive workloads behave differently.
GPU Monitoring Software for Gaming and Streaming
Gaming is where people have the strongest opinions about GPU tools, mostly because overlays fail at the worst time. For gaming, you want simple overlays and repeatable frametime captures.
MSI Afterburner + RTSS for Overlays on Windows
This combo is pretty popular because you can build a clean overlay with exactly the GPU metrics you care about, such as usage, clocks, VRAM, temps, frametime, and maybe fan speed.
One serious warning that keeps coming up in community threads is fake download sites. MSI’s own Afterburner page calls out that legitimate downloads should come from msi.com and Guru3D, and it also lists a current release line (4.6.6 final, released Oct 2025).
Overlay issues are another thing to look out for. For example, RTSS works in some games and fails in others, especially modern render paths. People report cases where the overlay shows in Vulkan but not DX12 for the same title, or disappears after updates.
However, that’s not because of an error on your part, just what happens when overlays hook into changing game and driver stacks.
If you want a stable baseline overlay, keep it short:
- frametime
- GPU usage
- VRAM used
- GPU temperature
Add power and clocks only if you’re actively debugging throttling.
Frametime Capture for “Stutter”
This is where performance monitoring apps that can capture frametime graphs help a bunch. Average FPS can look fine while frame pacing feels awful. Frametime graphs settle that confusion fast.
Many gaming benchmark workflows rely on PresentMon under the hood, and NVIDIA documents that its FrameView analytics use PresentMon for frame rate and frame time capture.
You don’t need to benchmark every game. Frametime capture is most useful for comparisons, like before and after a driver update, before and after changing a limiter, before and after swapping settings, and so on.
MangoHud for Linux Overlays
On Linux, MangoHud gets recommended a lot because it’s lightweight and integrates cleanly with Steam/Proton setups. The most common complaints are about missing sensors or odd readings on hybrid laptop setups.
In practice, you can easily pair MangoHud with a terminal checker like nvtop. It’s also a nice example of how GPU monitoring software works significantly better as a small stack, instead of one huge monster app.
From gaming, the natural next step is workstation monitoring, because that’s where logs and reproducible troubleshooting are your priorities.
 Get Your Game Face ON
Impress your friends on game night or just start a commercial multiplayer server for Minecraft, Virtual TableTop games, and more!
Get Your Game Server
GPU Monitoring Software for Workstations and Pro Apps
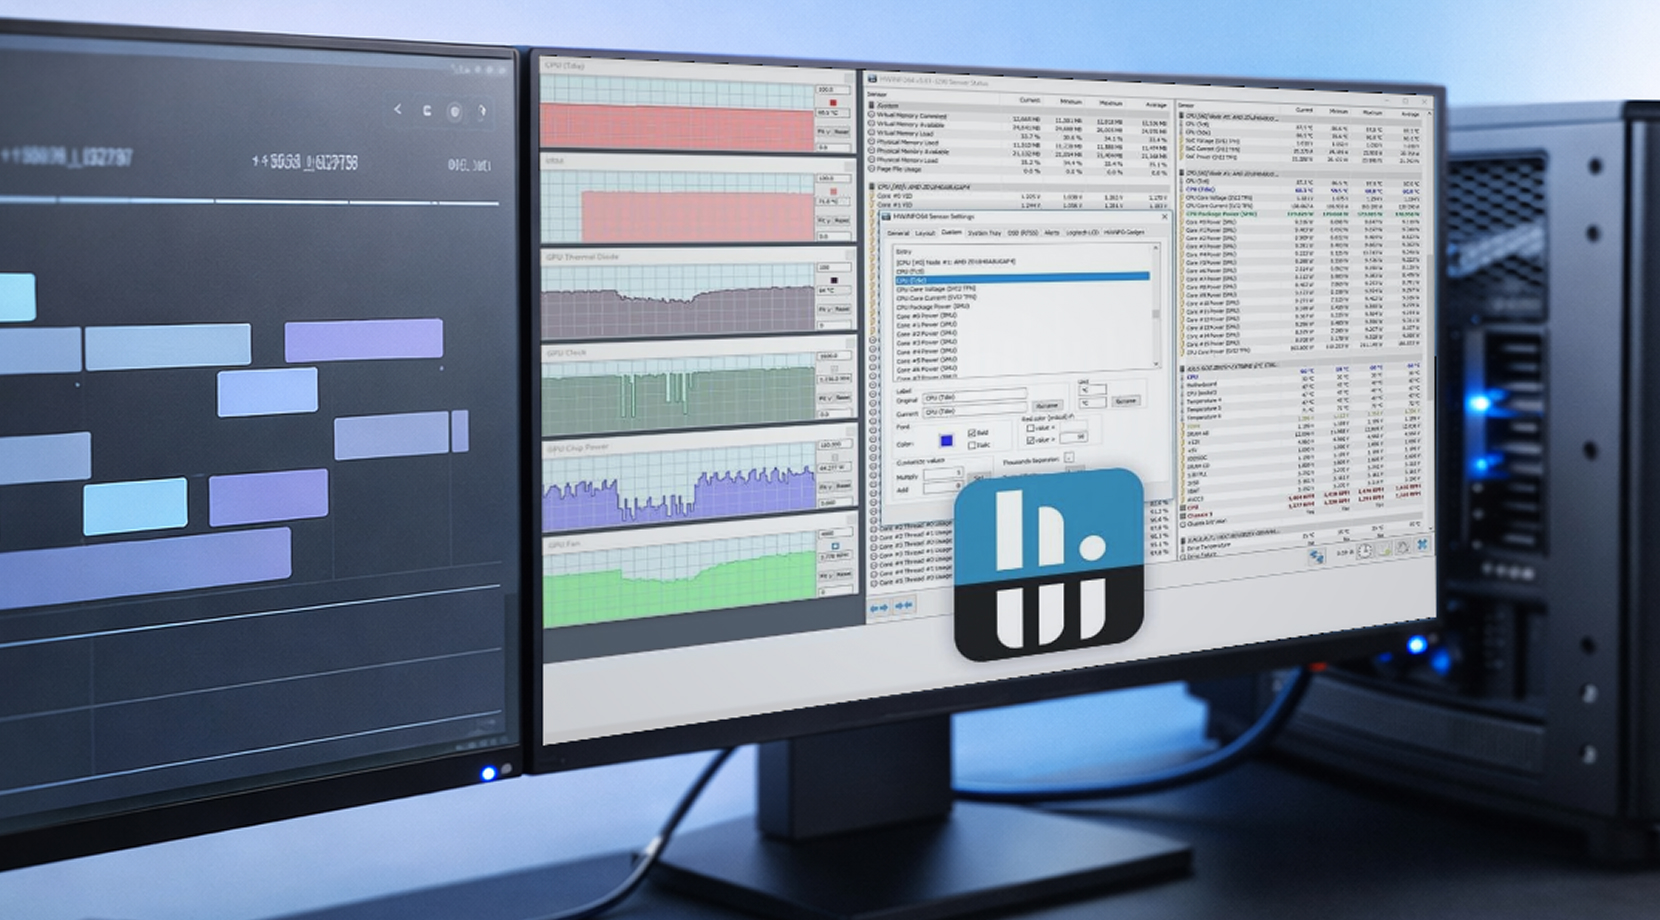
Workstation monitoring is much less of a security officer kind of job where you’re watching a live overlay, and more about answering “What happened over time, and can I reproduce it?”
HWiNFO for Logging on Windows
HWiNFO is popular in workstation circles because it has deep sensor coverage and logging that’s easy to share. A simple CSV log with timestamps can easily make a vague report something you can actively use to fix issues.
If you’re building a workstation log for GPU stability, start with these GPU metrics:
- GPU temperature and hotspot
- VRAM used
- board power
- core clock
- CPU package power (because platform power limits can bite you)
This is the “enough data to explain it” set. That’s because logging every sensor just makes the file harder to read.
GPU-Z for Quick “What GPU Is This?” Checks
GPU-Z is still useful because it’s fast and focused. On teams with mixed hardware, it’s the quickest way to confirm the GPU model, driver basics, and live sensors without digging through menus.
Stress Testing: Only Useful With Logging
Stress tests can help reproduce a crash, but only if your GPU monitoring software is logging while you run them. Without those logs, you’re left with “it crashed again” and pretty much no timeline.
At this point, most people hit the same problems, like overlays not showing, power readings looking wrong, and logs becoming unreadable. Let’s deal with those directly.
Common Problems With GPU Monitoring Software and Quick Fixes
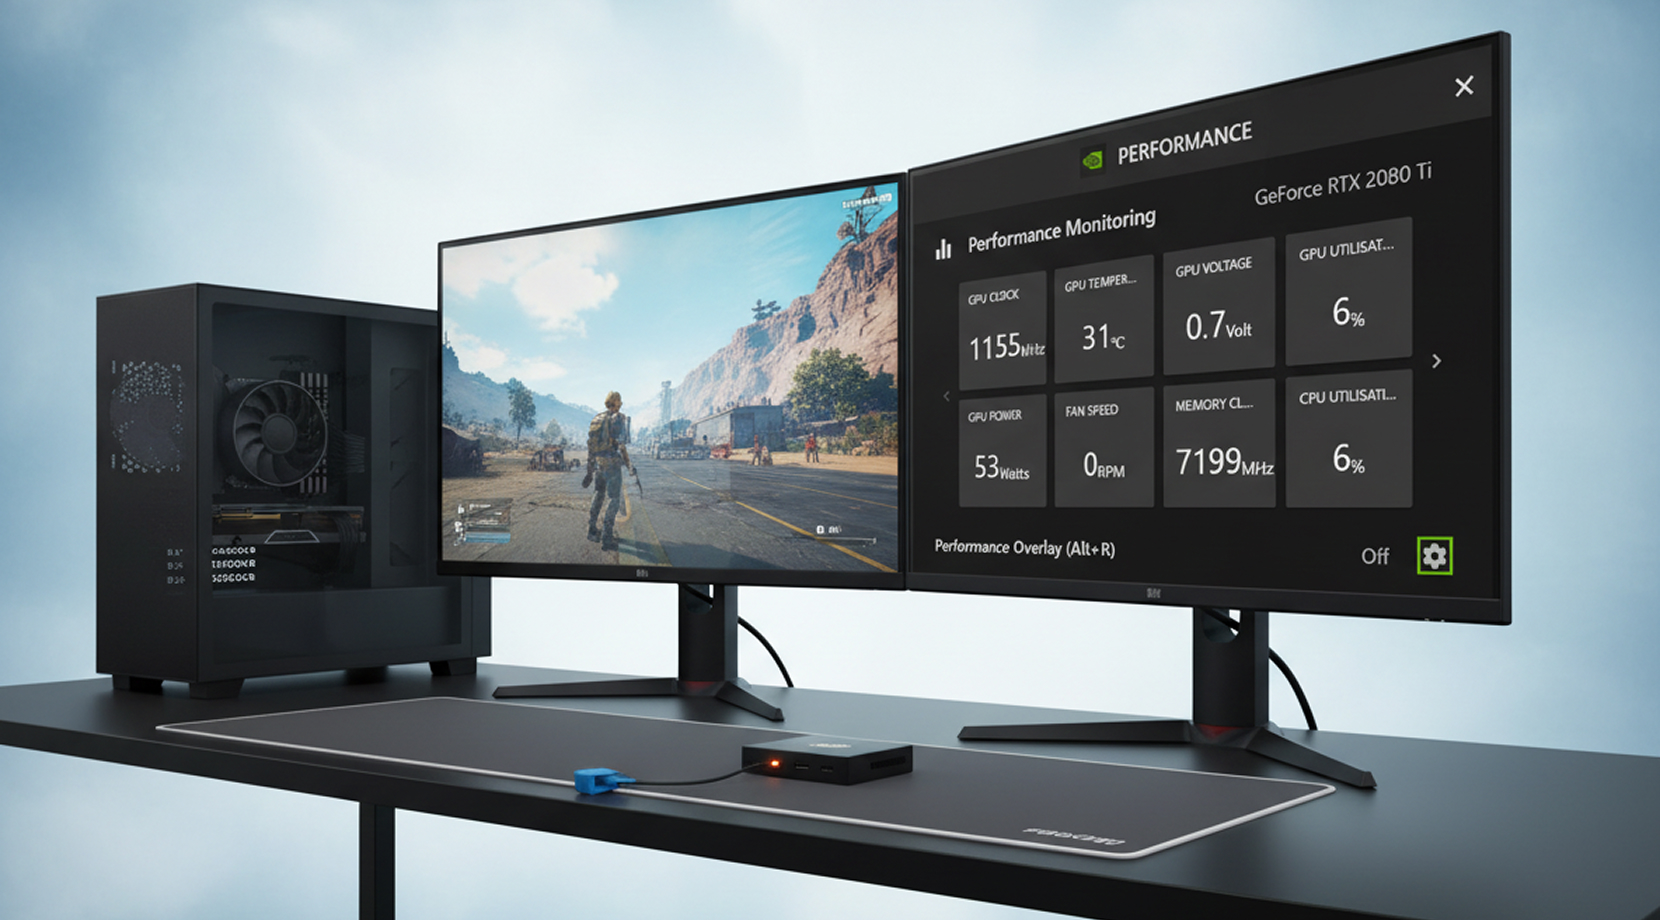
Most problems fall into a few patterns. These are the fixes I try first because they solve the boring stuff quickly.
Overlay Missing in a Game
If an overlay disappears in a modern title, it’s often a per-game hook problem or a conflict with anti-cheat or anti-tamper layers.
What you can do that often helps:
- Update RTSS and reset the per-game profile
- Set a higher “application detection level” for the game profile
- Try a different API if the game supports it
- Fall back to built-in overlays when a title blocks third-party overlays
Not every game will cooperate, and it’s not worth losing hours to one stubborn title.
Weird Power Readings (0W, Flat Lines, Missing Sensors)
This shows up a lot on laptops and hybrid setups where the active GPU can change. In those cases, sanity-check with a second tool, like nvidia-smi (NVIDIA) or AMD SMI (AMD), as they are good “is the GPU actually active?” checks.
Logs Too Noisy
Oversampling is the usual reason. For most troubleshooting, 1 to 5 seconds is enough. For long AI jobs, 5 seconds is fine. Shorter intervals balloon file size and make charts harder to read.
Once those basics are handled, remote monitoring becomes the next logical step, because many GPU workflows now run off-machine.
Remote GPU Monitoring and a Practical Cloud Option
Remote work changes what “good GPU monitoring software” means. You’re not always staring at the machine, so you need checks you can run quickly, plus history you can review later.
A clean remote setup usually looks like this:
- CLI checks (nvidia-smi or AMD SMI)
- a log file you can pull later
- an exporter/dashboard if you need alerts
If you’re at the point where local hardware is blocking progress (VRAM limits, time-sharing a single GPU, needing a clean environment per project), running workloads on a GPU VPS can be the simplest way to keep moving.
Cloudzy GPU VPS
If you want remote GPU time that fits AI, gaming, and rendering workflows, our Cloudzy GPU VPS includes NVIDIA options like RTX 5090, A100, and RTX 4090, plus NVMe storage, full root access, up to 40 Gbps connections, DDoS protection, and a stated 99.99% uptime target.
From a monitoring angle, it behaves like a normal machine since you can run GPU monitoring software over SSH, log GPU metrics for long jobs, and add dashboards if you want history and alerting.
If you’re still deciding between a GPU instance and a CPU-only setup, our pieces on What Is a GPU VPS? and GPU vs CPU VPS lay out the practical differences by workload.
With remote monitoring covered, the last step is putting it all together into copyable stacks.
Copyable Stacks for Each Persona
Here are easy-to-follow stacks you can adopt without rewriting your whole workflow. These are great starting points for your setups that you can then tailor to your specific needs later on.
- Model Builder (AI/ML): GPU monitoring software via nvidia-smi or AMD SMI, plus a simple CSV log, plus an exporter/dashboard if jobs run unattended.
- Competitive Gamer/Streamer: GPU monitoring software overlay via Afterburner + RTSS, plus a frametime capture tool for comparisons, plus a minimal on-screen metric set.
- Workstation User: GPU monitoring software via HWiNFO logging, plus GPU-Z for quick identity checks, plus a stress test only when you can log the run.
- Admin Running GPU Machines: GPU monitoring software as a service: exporter + dashboards + alerts, plus per-process visibility (nvtop) for shared boxes.
If you only take one thing from this guide, make it this: pick GPU monitoring software based on where you need the data (overlay, log, dashboard), then keep your metric set small enough that you’ll actually use it.
