Fair Value Gap trading might sound like an obscure trading term, but for those in the know, it’s a goldmine for understanding market behavior. In this guide, we’ll explore everything you need to know about FVGs—from what they are to how you can use them to sharpen your trading game. FVGs aren’t just for advanced traders; anyone willing to learn can use them to get a clearer picture of what’s happening in the market.
What Is a Fair Value Gap?
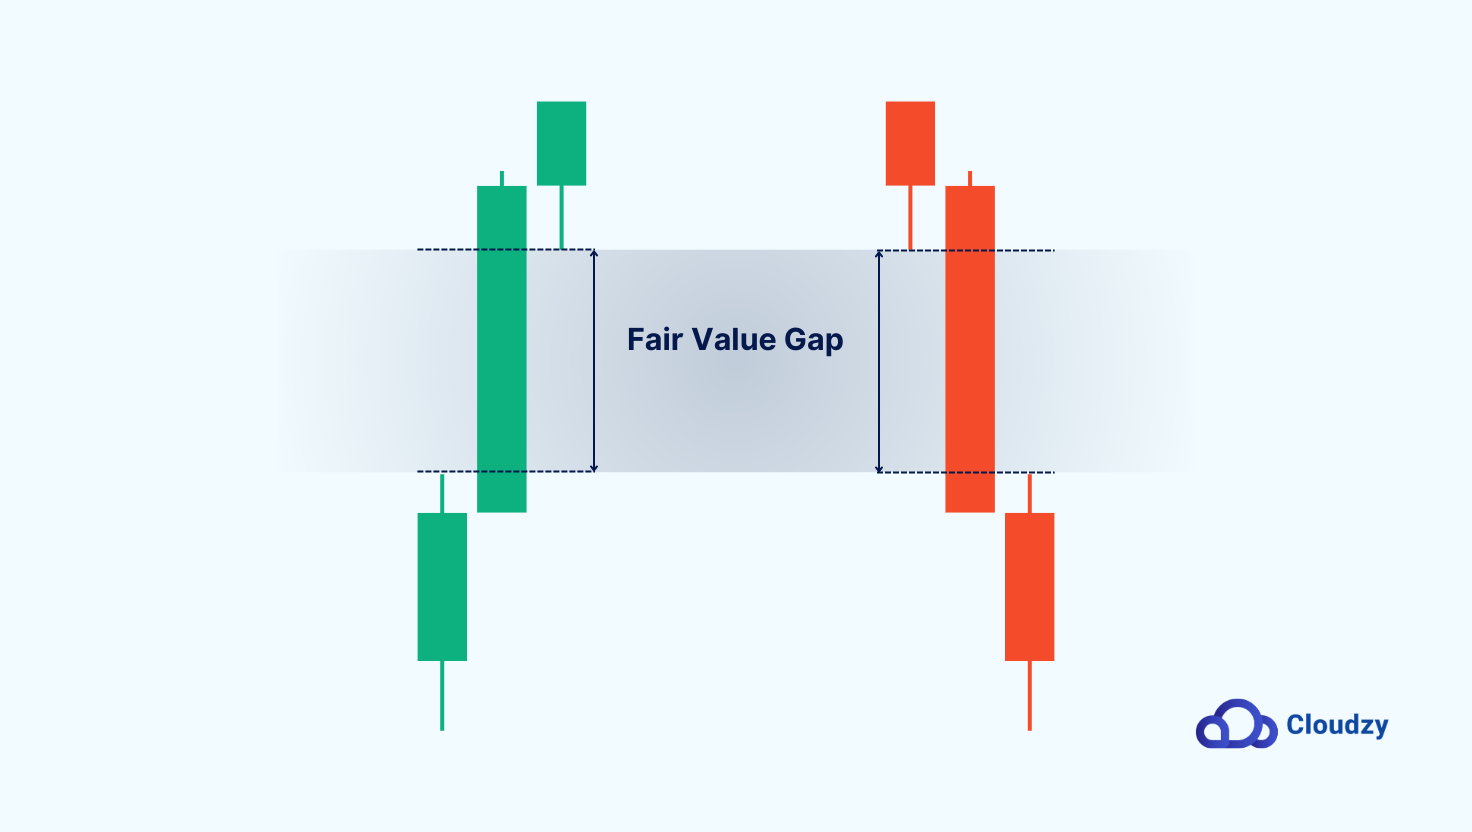
Technically, Fair Value Gaps (FVGs) are a form of indicator that marks areas where the usual balance of supply and demand has broken down. They show up when prices move so quickly that certain price levels are completely skipped over. What’s left is a kind of void in price action, a space where no trades occurred.
The beauty of FVGs lies in their predictability. Markets don’t like imbalance; they crave order. These gaps are often revisited as prices retrace to “fill” them, giving traders reliable zones to plan entries or exits.
Research also shows a high probability of gaps fading, especially in longer time frames, making them dependable for traders aiming to spot corrections or liquidity rebalancing.
FVGs aren’t just technical phenomena—they’re insights into how and where the market is reacting, rebalancing, and flowing. So, why do these imbalances happen, creating FVGs in the process?
Why Do Fair Value Gaps Form?
FVGs happen for a variety of reasons in a variety of markets. In Forex, they often appear after major economic shifts or unexpected announcements, marking areas where liquidity temporarily vanished. Other markets, like crypto and equities, see them during rapid price swings or spikes in trading volume. However, in any market, the following factors are the main reasons behind these gaps:
Institutional Players and Supply-Demand Imbalances
Institutional players play a significant role in creating Fair Value Gaps, as this research shows that institutions account for a remarkable 80% of stock market trading volume, which can push prices beyond typical levels. Additionally, considerable supply-demand imbalances, such as large institutional orders made outside of trading hours, often lead to these gaps when markets reopen.
Economic Updates and News Releases
Market movements can really heat up with major economic announcements, like GDP releases or employment reports. If these updates come outside of regular trading hours, expect some Fair Value Gaps as things settle down once the market reopens.
Profit Statements
Another big factor that stirs up the market is, of course, earnings reports. When surprising positive or negative earnings are reported, you can definitely expect sharp price movements at market opening, leading to gaps between the closing and opening prices.
Market Sentiment
Last but certainly not least, market sentiment can shift quickly due to things like natural disasters, geopolitical events, or just changes in how confident investors feel. When this happens, you might see some fast price movements in the market, often leading to gaps in fair value, whether from panic buying or selling.
Disclaimer: This blog is for educational purposes only. Trading carries significant risk and may not be suitable for all investors. Always consult a licensed financial advisor before making any major decisions. The author is not responsible for any losses or damages incurred from applying these strategies.
How to Identify Fair Value Gaps on a Chart
The most reliable way to identify an FVG is through the three-candlestick pattern:
- Candle 1: The first candle moves in the trend’s direction, either up or down.
- Candle 2: The second candle makes a sharp move, skipping over price levels and leaving a gap.
- Candle 3: The third candle continues the move, leaving a visible void between the wicks of Candle 1 and Candle 3.

Now that we’ve covered the basics, understand how they form, and answered the question, “What is a Fair Value Gap (FVG)?” let’s explore the different types of FVGs and what they reveal about market behavior.
Types of Fair Value Gaps
Now, each type of FVG has its own visual markers and behavioral tendencies, which can give you valuable clues about market dynamics. From a massive gap visible from a mile away to a subtle imbalance that requires a trained eye, understanding these types will help you make more informed decisions.
Bearish Fair Value Gaps
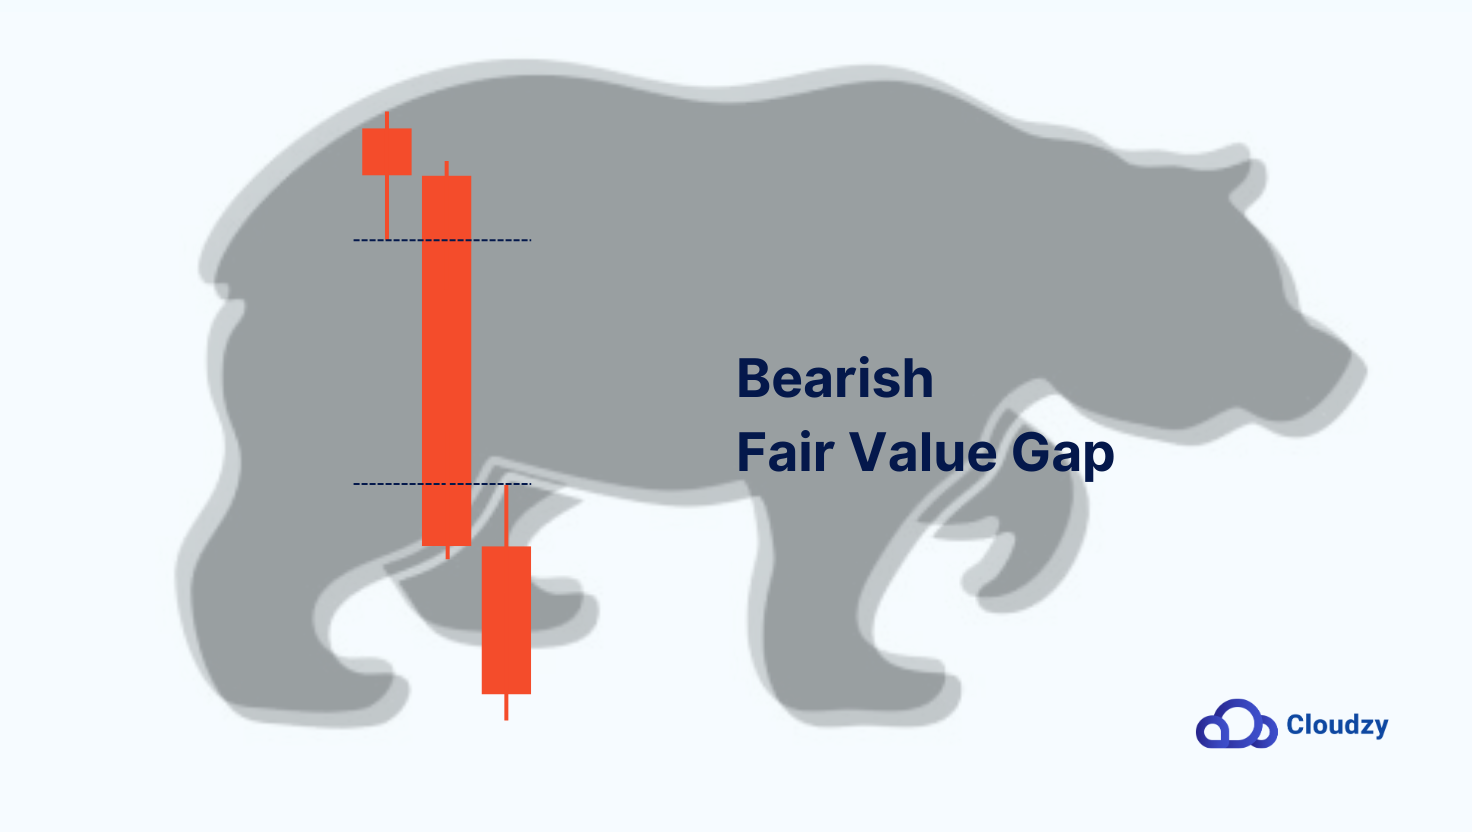
Bearish FVGs, or SIBI (Sellside Imbalance, Buyside Inefficiency), are a sign of strong selling pressure. They form when prices drop so quickly that they leave an untraded zone above the current level. Visually, you’ll see a sharp downward movement where the wicks of two candles fail to overlap, leaving a clear “void” on the chart.

Bullish Fair Value Gaps
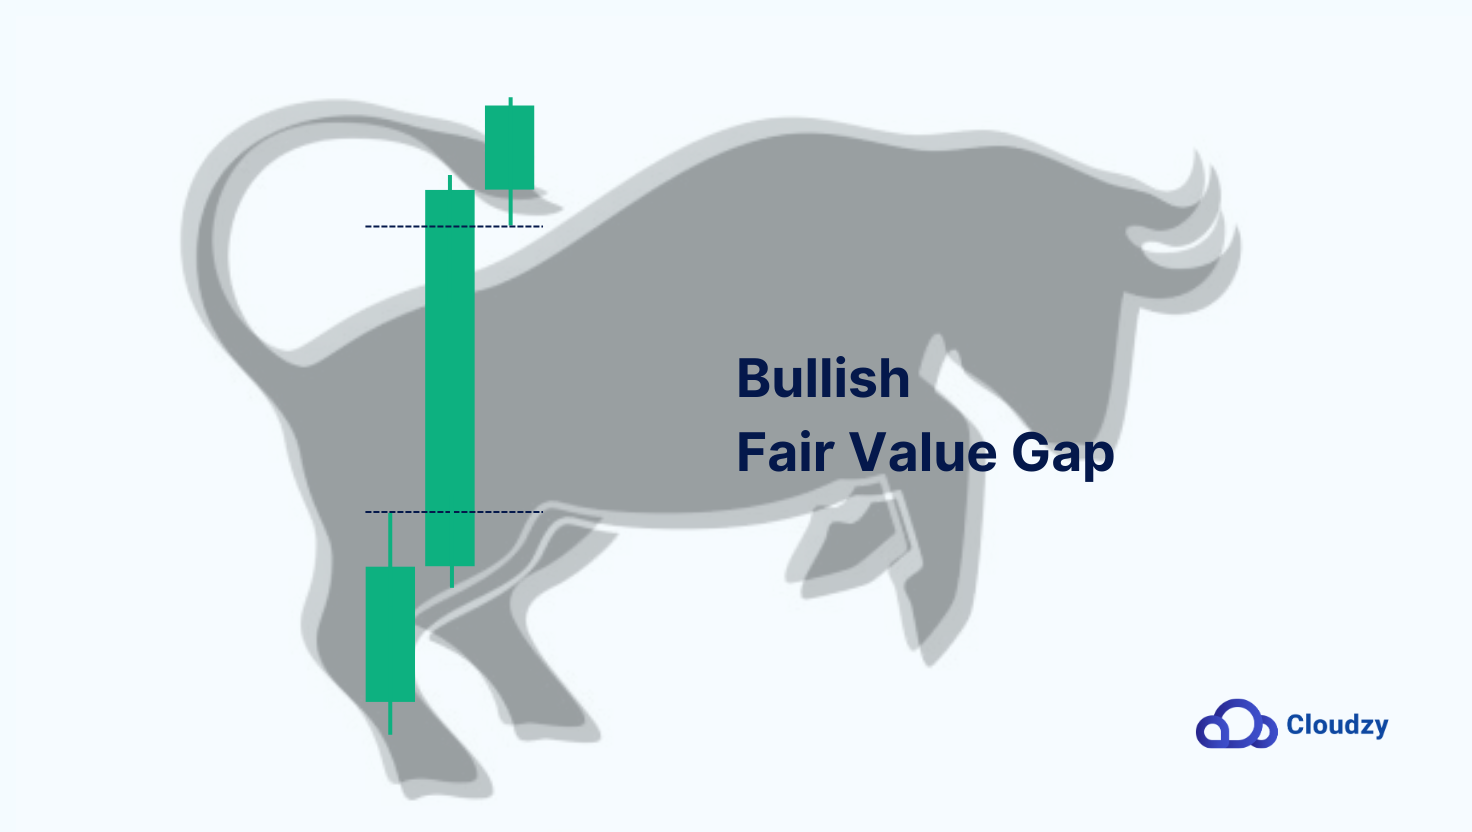
Bullish FVGs, technically known as BISI (Buyside Imbalance, Sellside Inefficiency), on the other hand, appear when buying pressure dominates, driving prices upward so quickly that untraded zones are left below. You’ll spot these by looking for a sharp upward move where the lower wick of one candle doesn’t overlap with the upper wick of the previous candle.

Implied Fair Value Gaps
Implied FVGs are less obvious. Unlike traditional gaps, they don’t leave an untraded space on the chart. Instead, these gaps are marked by large candles with long wicks on either side, signaling a rapid price move where liquidity thinned out.
Inverse Fair Value Gaps
Inverse FVGs occur when a gap switches roles. A bullish FVG can become bearish (or vice versa) if prices fail to respect the gap’s support or resistance. This reversal often happens in volatile markets when sentiment shifts dramatically.
Speaking of trading charts and patterns, check out our comprehensive post on Key Forex Chart Patterns!
Alright, we’ve covered everything you need to know in theory about FVGs; now, for the actual trading bit. I’ve basically condensed all of what my years of FVG trading have taught me into a concise, easy-to-understand format, so let’s get to it.
How to Trade FVGs
Now, there are many FVG trading strategies to profit from, with plenty of folks giving tips. But what I’m sharing with you is more like a personal checklist— a setup that has worked for me, and one I’ve put in the effort to develop so you can confidently start FVG trading.
Key Points on Timeframes
- Start with higher timeframes: Monthly, Weekly, and Daily for a clear market view.
- Higher timeframes show trends from major players like institutions and hedge funds.
- Once you identify the trend, switch to lower timeframes based on the correct timeframe alignment.
Timeframe Alignment
- Each timeframe correlates with a certain lower timeframe, not any lower timeframe.
- Higher timeframes guide the trend, lower ones help with execution.
- Here’s how they correlate:
- FVG on Monthly → entry on 4-hour chart.
- FVG on Weekly → entry on 1-hour chart.
- FVG on Daily → entry on 15-minute chart.
- FVG on 1-hour → entry on 1-minute
Identifying Good FVGs
- FVGs can only be filled once. Avoid trading once the gap is filled.
- Old FVGs help identify future gaps and market trends.
- Reinforced Trend: A strong FVG often follows another gap in the same direction.
- Consolidation or Rejection:
- A small third candle indicates a strong FVG, suggesting the gap will likely fill and the trend will continue.
- Large candles or rejections signal potential reversal or slowdown.
How to Trade Gaps
After identifying the third candle:
- Check if it follows a previous FVG.
- A small consolidation candle is a good sign for trend continuation.
- Large or rejected candles suggest a reversal.
Sharp Turn Entries
- Look for a fresh FVG forming as price moves away from higher timeframe FVG.
- This indicates market manipulation; watch for new FVGs to place entry.
Breakaway vs. Rejection FVGs
- Breakaway FVGs:
- Typically don’t return to the gap as they indicate a strong trend.
- Great for immediate entries, but the gap will not be filled.
- Rejection FVGs:
- Require more confirmation (e.g., move from Daily to 1-hour chart).
- A 4-hour sharp turn entry can provide additional confirmation.
- Closer timeframes need less confirmation (e.g., Daily to 1-hour).
I know your trader friend might not fully approve of these techniques, but my advice is to bookmark this page or save it to your PC and use it when trading. You can gradually edit and optimize it for yourself, turning it into your own FVG trading cheat sheet. I’ll also be updating this (fingers crossed), so your feedback will be valuable to both me and others.
Tools and Indicators for FVG Trading
One thing I’ve learned through the years is that no matter how good you are at something, you can always use the help of tools to guarantee your judgment. So here are a few of the tools and useful trading indicators I personally use whenever I have a sliver of doubt:
- Moving Averages: Moving averages, particularly the 50- and 200-day lines, are basic, yet very helpful tools for gauging the broader trend around an FVG. If an FVG aligns with a moving average (e.g., acting as support or resistance), it strengthens the likelihood of a price reaction.
- Volume Profile: Volume is a universal factor in trading. Tools like the volume profile indicator visualize trading activity, and a high-volume node overlapping with an FVG suggests institutional interest, improving the FVG’s reliability.
- Fibonacci Retracement: The Fibonacci retracement tool is a popular choice for discovering possible reactions within an FVG. When you draw the retracement levels, it’s easier to see if an FVG corresponds with important zones like the 61.8% level, which frequently serves as a reversal point.
- RSI and MACD: Momentum indicators like RSI (Relative Strength Index) and MACD (Moving Average Convergence Divergence) are invaluable for confirming FVG setups. An overbought RSI near a bearish FVG or an MACD crossover near a bullish FVG gives that extra confirmation.
How to Use These Tools Effectively
Combining these tools is the secret to creating an effective Fair Value Gap strategy. For example, if a bullish FVG coincides with a 61.8% Fibonacci retracement, aligns with a 50-day moving average, and is supported by a volume spike, you have a high-confidence setup. Always look for multiple confirmations to increase the reliability of your trades.
However, keep in mind that no tool is foolproof. Tools and indicators are meant to support your FVG trading strategy, not replace it. Practice combining them in real-world scenarios, and over time, you’ll develop an intuitive sense of how to use these tools in harmony with FVGs.
Lastly, technical indicators require a stable, low-latency connection. Cloudzy’s Forex VPS services provide an affordable 99.95% uptime 10Gbps connection to pre-installed MT4 and MT5 trading platforms, which will be a blessing for trading activities.
 Want to Improve your Trading?
Give yourself a better chance at the Forex market by hosting your trading platform right next to your broker.
Get a Forex VPSFinal Thoughts
No guide, especially on Fair Value Gap strategies, would be complete without risk management. I often overlooked this early in my trading career, and it cost me. One key principle I live by is breaking even once the trade has moved in my favor.
If I enter a trade based on a 4-hour FVG and the price begins to target my 1:2 risk-to-reward, I’ll monitor for new gaps forming below my entry. If those gaps appear, I’m comfortable moving my stop to break even. Why? Well, these gaps suggest that the price is likely to continue lower, even if there’s a small retracement.
So, once the market shows signs that it’s in line with my trade, I don’t want to risk going back to my entry point. That’s why the best advice I can give you is to stick to your plan, manage risk, and don’t be afraid to lock in safety when the market gives you a solid signal.
FAQ
Is Fair Value Gap trading profitable?
Yes, Fair Value Gap trading can be pretty profitable if you play them right! Prices tend to “fill” these gaps around 70-80% of the time, which gives you a solid chance of catching a move back into that gap zone. However, it’s important to recognize that this percentage can fluctuate based on market conditions, asset classes, and the specific type of gap.


One thought on “What Is a Fair Value Gap? A Complete Guide to FVG Trading Strategies”
Hello Nick. I cannot thank you enough for this masterpiece. You have saved me tons of time and effort as a starter. I’m curious to know if you have a similar article for Liquidity and Order blocks.