Virtual Private Servers have become the key infrastructure for businesses and developers worldwide. The VPS market reached $5.2 billion in 2025 and continues growing as more organizations move to cloud-based hosting solutions. Despite this growth, many users experience frustrating performance issues with their servers.
When your VPS runs slowly, it affects everything from website loading times to application performance. Research shows that 53% of mobile users abandon websites that take longer than 3 seconds to load, making server performance tied to user experience and business outcomes.
This guide examines “why is my VPS so slow” and shows you how to speed things up. We’ll go through the common causes and their fixes, so you can get your server back on track.
Common Causes of VPS Slowness
Knowing “why is my VPS so slow” requires examining multiple factors that affect server efficiency. Resource limitations are the most common culprit.

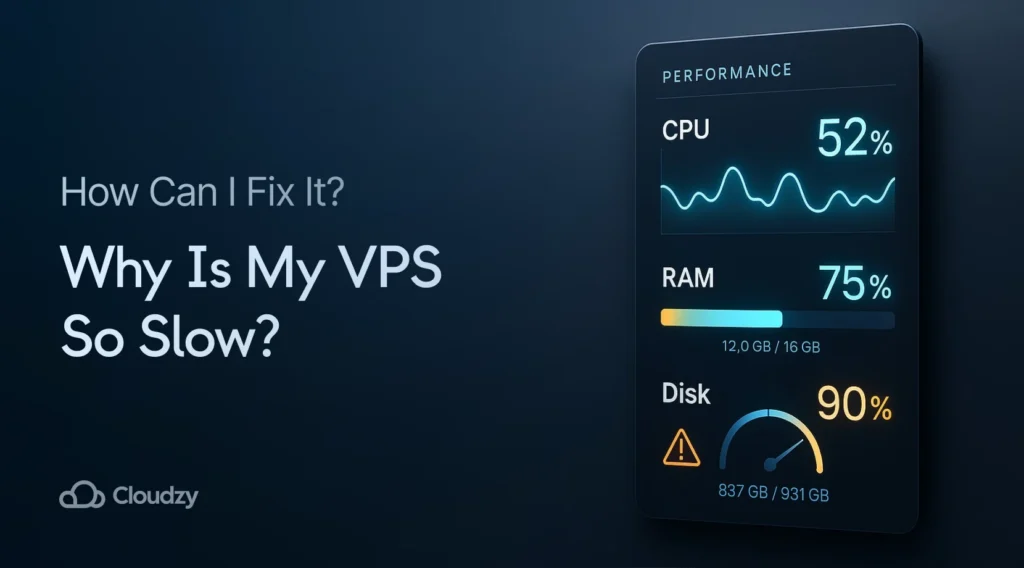
When your VPS lacks sufficient CPU cores, RAM, or disk space, processes compete for available resources and create bottlenecks.
Insufficient RAM forces systems to use slower disk-based swap space, while high CPU usage indicates processes consuming more power than allocated. Disk I/O performance critically affects speed. Traditional hard drives create bottlenecks compared to SSDs, and high wait times mean your system spends significant time completing read and write operations.
Network issues also contribute substantially to slowness. Bandwidth limitations, high latency, and connection delays all impact response times. Poor network configuration compounds these problems.
Software issues often slow things down, too. Outdated systems run inefficient code that eats up resources, while poorly configured web servers or databases create bottlenecks even when your hardware can handle the load.
Security threats present another major cause. Malware and unauthorized access hijack resources for malicious purposes, while DDoS attacks overwhelm servers with traffic designed to make them unresponsive.
How to Diagnose VPS Performance Issues
Identifying “why is my server so slow” requires systematic diagnosis using monitoring tools. Start by checking resource usage to pinpoint bottlenecks.

For Linux systems, htop provides an interactive, color-coded interface showing CPU usage per core, memory consumption, and running processes. Access it via SSH:
htopThe display shows CPU cores at the top, memory usage below, and a sortable process list. Look for processes consuming excessive resources.
Glances offers comprehensive monitoring for CPU, memory, disk I/O, and network activity:
pip3 install glances

glances
Enable web access with glances -w and visit your server IP on port 61208. 61208 is the web UI/API in web mode; 61209 is the default in server mode.
Check specific metrics:
CPU: Run vmstat 1 for statistics updated every second. High “wa” values indicate I/O wait time.
Memory: Execute free -h to view available RAM and swap usage. High swap with maxed RAM signals insufficient memory.
Disk I/O: Use iostat -x 1 to monitor disk performance. High utilization and long wait times reveal bottlenecks.
Network: Run ip -s link to check interface statistics. Dropped packets or errors indicate network problems.
Record baseline metrics during normal operation to compare against slowness periods.
Resource Allocation and Shared Hosting
Ever notice your VPS slow down during peak hours even though you’re not doing anything different? This comes down to resource allocation. In shared environments, multiple servers compete for the same CPU, RAM, and disk I/O.
This “noisy neighbor” effect happens when the underlying physical hardware reaches capacity. Your server might be within limits. But if others max out their usage, everyone suffers from CPU throttling, memory pressure, and disk I/O bottlenecks.

Resource contention shows up in a few ways. CPU throttling happens when the host limits your power because demand exceeds the available cores. Memory pressure hits when the physical server runs low on RAM, and the host system reclaims memory to keep the node stable.
Disk I/O bottlenecks also develop when multiple users perform heavy read and write operations simultaneously on shared storage. Plus, hosts using older CPUs or traditional hard drives create consistent performance problems across all users.
The fix is using dedicated instances. This reserves CPU cores for your server so that neighbors cannot affect your processing power. At Cloudzy, our VPS plans provide dedicated resources with NVMe SSD storage and network speeds up to 40 Gbps across 16+ locations, keeping your performance steady.
While dedicated resources cost more, they prevent slowdowns caused by other users. This provides predictable behavior for production websites or real-time applications.
Remote Access Protocols and Performance
The protocol you use to access your Windows VPS affects performance and often explains “why is my VPS so slow”. Choosing the wrong one creates unnecessary slowness.
Virtual Network Computing transmits screen updates using a framebuffer-based protocol. Even with compression, this requires substantial bandwidth for every change. This pixel-based approach works across operating systems but creates overhead affecting performance.
Remote Desktop Protocol uses a more efficient method. It transmits drawing primitives and compressed bitmaps. Your local client renders the data. This lowers bandwidth usage and speeds up the response.
For Windows Server environments, RDP offers several advantages. It integrates with Windows graphics subsystems, enabling hardware acceleration and efficient updates.
RDP supports printer redirection, clipboard sharing, and audio with minimal performance impact.

Use RDP when:
- Connecting to Windows Server 2019, 2022, or 2025
- Running GUI applications requiring smooth performance
- Working with applications displaying frequent screen changes
Use VNC when:
- Connecting to Linux servers
- Requiring cross-platform access from non-Windows systems
- Needing to troubleshoot before RDP is configured
Server Location and Network Latency
Physical distance between your VPS and users affects performance through network latency. Data travels at finite speeds, and geographical separation adds measurable delays that make your VPS slow.
Network latency measures the time required for data to travel from source to destination. In fiber optic networks, every 1,000 kilometers typically adds about 10 milliseconds of round-trip latency. These delays compound across multiple network hops.

For trading applications, latency impacts execution speed. Even milliseconds can mean the difference between executing favorable trades or missing opportunities. Trading firms often colocate servers in the same data centers as exchanges to minimize distance.
Website hosting, especially, benefits from reduced latency. The closer your server is to users, the faster they get content. Dynamic pages that pull from databases still depend on your origin server location, even when CDNs handle static files like images and CSS.
Testing latency helps identify geographical issues. Use ping tests or traceroute to measure round-trip times from various locations.
Choose server locations strategically:
Trading applications: Select servers in the same metropolitan area as your broker or exchange.
Regional websites: Choose data centers within or near your primary market.
Global applications: Consider multi-region deployments or evaluate which region minimizes average latency to all users.
Software Updates and System Maintenance
Outdated software creates performance problems and security vulnerabilities. If you’re asking, “Why is my VPS so slow?”, outdated operating systems, web servers, databases, and applications could be the answer.
Developers continuously improve products by fixing bugs, patching security holes, and optimizing code. Running outdated versions means missing these improvements and using inefficient code that wastes resources.
Modern distributions like Ubuntu 24.04 LTS, Debian 13, and Rocky Linux 10 include kernel optimizations and updated libraries, improving resource management. Windows Server 2022 and 2025 provide similar enhancements over older versions.
Web servers like Apache and Nginx release updates fixing memory leaks and improving connection handling. Database systems especially benefit from updates with improved query execution and caching.

Establish a maintenance schedule:
Weekly: Apply security updates and critical patches.
Monthly: Install general software updates after testing in staging.
Quarterly: Audit installed software, remove unused applications, and optimize configurations.
Create backups and verify rollback procedures before major updates.
Security Threats and Performance Impact
Security issues cause major performance degradation through resource hijacking. When wondering “why is my VPS so slow?”, malware, DDoS attacks, and unauthorized access could be draining your resources.
Malware consumes resources for malicious purposes. Cryptominers max out CPU for cryptocurrency generation, botnets relay spam, consuming bandwidth, and rootkits hide processes that drain resources.
You can consistently detect malware through regular audits. Monitor for unexpected high-CPU processes, check for unauthorized accounts, and use tools like ClamAV or rkhunter to identify threats.

DDoS attacks overwhelm servers with excessive traffic. Configure firewalls to block suspicious patterns and rate-limit connections. Cloud-based DDoS mitigation services filter traffic before it reaches your server.
Lastly, secure SSH access to prevent unauthorized entry. Disable password authentication for key-based login, change the default SSH port, and implement fail2ban to block repeated failed attempts.
Restrict access to specific IP addresses when possible.
Maintain security through:
- Automatic security updates for quick vulnerability patching
- Configured firewalls allowing only necessary ports
- Monitoring for unusual resource usage patterns
- Regular log reviews for suspicious activity
- Strong authentication with complex passwords or keys
Optimization Strategies and Fixes
Resolving “why is my VPS so slow” requires targeted fixes based on specific bottlenecks. Apply these optimization strategies to address common issues.

For resource constraints, upgrade your plan to include more CPU, RAM, or storage. Monitor usage patterns to determine needs.
Linux uses free RAM for caching. High usage numbers are often normal. Watch for low “available” memory or heavy swap use instead. If you see “Out of Memory” errors, you need more RAM. When the CPU stays high during normal operation, add cores.
Disk performance is another major factor. Upgrading to NVMe SSD storage delivers read and write speeds exceeding 1000 MB/s compared to traditional hard drives at only 175 MB/s, making operations over five times faster. Pair this with filesystem caching and application-level caching using Redis or Memcached to keep frequently accessed data readily available.
For technical optimizations, focus on these areas:
Database optimization:
- Add indexes to frequently queried columns
- Analyze slow query logs
- Configure connection pooling
- Increase buffer pool sizes for caching
Web server tuning:
- Adjust worker processes and connections based on traffic
- Enable compression for text content
- Implement static file caching
- Configure keep-alive connections
Process management:
- Identify resource-hungry applications with htop
- Terminate stuck processes
- Configure automatic monitoring
- Set resource limits to prevent monopolization
When a single VPS can’t handle demand anymore, load balancing spreads the load across multiple servers. Use reverse proxy servers to route requests, or consider horizontal scaling by adding more server instances.

Conclusion
VPS performance issues typically stem from resource constraints, network latency, outdated software, and security threats. Start by establishing baseline metrics using monitoring tools to identify specific bottlenecks.
Address critical issues first through resource upgrades, software updates, and configuration optimization. Systematic diagnosis combined with targeted fixes restores optimal server performance effectively.
Regular maintenance prevents performance degradation over time. Schedule weekly security updates and monthly software reviews to stay ahead of potential problems.